7.7 KiB
2D Extremity Temporal Decomposition
Goal: Test whether the "flat single-dimension trend" masks diverging trajectories when stylistic and material extremity scores are analyzed separately over time.
Analysis period: 2016-2026
Data source: extremity_scores_2d (2,869 motions scored) joined with right_wing_motions
Domains: Migration = asiel/vreemdelingen; Non-migration = all other categories
*Years with <50 scored motions are flagged for low confidence.
1. Key Findings
Overall correlation r(stijl, materieel): 0.470 (p=0.000000) Migration domain r(stijl, materieel): 0.467 (p=0.000000, n=379) Non-migration domain r(stijl, materieel): 0.427 (p=0.000000, n=2471)
2. Pre/Post 2024 Comparison
| Dimension | Pre-2024 Mean | Post-2024 Mean | Δ |
|---|---|---|---|
| Stylistic extremity | 1.718 | 1.815 | 0.097 |
| Material impact | 2.530 | 2.384 | -0.146 |
| Text score (original) | 2.044 | 2.178 | 0.134 |
| Gap (M-S) | 0.813 | 0.570 | -0.243 |
3. Yearly Data Table
| Year | N | Stylistic | Material | Text (orig) | Gap (M-S) | N Mig | Styl Mig | Mat Mig | N Non-Mig | Styl NM | Mat NM | r(stijl,mat) |
|---|---|---|---|---|---|---|---|---|---|---|---|---|
| 2016 * | 6 | 1.667 | 2.333 | 2.000 | 0.667 | 0 | N/A | N/A | 6 | 1.667 | 2.333 | N/A |
| 2017 * | 0 | N/A | N/A | N/A | N/A | 0 | N/A | N/A | 0 | N/A | N/A | N/A |
| 2018 * | 5 | 1.000 | 1.400 | 1.400 | 0.400 | 0 | N/A | N/A | 5 | 1.000 | 1.400 | N/A |
| 2019 | 189 | 2.058 | 2.921 | 2.153 | 0.862 | 15 | 2.933 | 2.867 | 174 | 1.983 | 2.925 | 0.483 |
| 2020 | 446 | 2.231 | 2.899 | 2.213 | 0.668 | 45 | 3.267 | 3.378 | 401 | 2.115 | 2.845 | 0.608 |
| 2021 | 409 | 1.751 | 2.973 | 2.205 | 1.222 | 30 | 2.900 | 3.800 | 379 | 1.660 | 2.908 | 0.496 |
| 2022 | 412 | 1.769 | 2.507 | 2.121 | 0.738 | 71 | 2.225 | 3.042 | 341 | 1.674 | 2.396 | 0.440 |
| 2023 | 353 | 1.550 | 2.680 | 2.215 | 1.130 | 59 | 2.169 | 3.254 | 294 | 1.425 | 2.565 | 0.338 |
| 2024 | 455 | 1.686 | 2.578 | 1.974 | 0.892 | 55 | 2.545 | 3.091 | 400 | 1.567 | 2.507 | 0.385 |
| 2025 | 429 | 1.697 | 2.322 | 2.231 | 0.625 | 78 | 2.487 | 3.269 | 351 | 1.521 | 2.111 | 0.589 |
| 2026 | 146 | 2.062 | 2.253 | 2.329 | 0.192 | 26 | 2.500 | 2.769 | 120 | 1.967 | 2.142 | 0.410 |
- Years with <50 scored motions; confidence intervals are wider or N/A.
4. Divergence Test (Wilcoxon Signed-Rank)
Test: wilcoxon_signed_rank
Statistic: 0.0
p-value: 0.001953125
N yearly pairs: 10
Conclusion: Significant divergence: material and stylistic yearly means differ (W=0.0, p=0.0020)
The Wilcoxon signed-rank test compares yearly mean stylistic vs yearly mean material scores. A significant result (p < 0.05) indicates the two dimensions systematically differ, meaning the flat single-dimension trend masks a genuine divergence between stylistic and material extremity.
5. Per-Year Correlation Analysis
| Year | r(stijl,mat) | p | N | Domain |
|---|---|---|---|---|
| 2016 | N/A | N/A | 6 | All |
| 2017 | N/A | N/A | 0 | All |
| 2018 | N/A | N/A | 5 | All |
| 2019 | 0.483 | 0.000000 | 189 | All |
| 0.844 | 0.000077 | 15 | Migration | |
| 0.471 | 0.000000 | 174 | Non-migration | |
| 2020 | 0.608 | 0.000000 | 446 | All |
| 0.447 | 0.002064 | 45 | Migration | |
| 0.610 | 0.000000 | 401 | Non-migration | |
| 2021 | 0.496 | 0.000000 | 409 | All |
| 0.597 | 0.000501 | 30 | Migration | |
| 0.446 | 0.000000 | 379 | Non-migration | |
| 2022 | 0.440 | 0.000000 | 412 | All |
| 0.543 | 0.000001 | 71 | Migration | |
| 0.344 | 0.000000 | 341 | Non-migration | |
| 2023 | 0.338 | 0.000000 | 353 | All |
| 0.501 | 0.000052 | 59 | Migration | |
| 0.222 | 0.000124 | 294 | Non-migration | |
| 2024 | 0.385 | 0.000000 | 455 | All |
| 0.086 | 0.531026 | 55 | Migration | |
| 0.376 | 0.000000 | 400 | Non-migration | |
| 2025 | 0.589 | 0.000000 | 429 | All |
| 0.558 | 0.000000 | 78 | Migration | |
| 0.445 | 0.000000 | 351 | Non-migration | |
| 2026 | 0.410 | 0.000000 | 146 | All |
| 0.421 | 0.032410 | 26 | Migration | |
| 0.317 | 0.000411 | 120 | Non-migration |
6. Correlation Change Pre vs Post 2024
Pre-2024 mean r(stijl,mat): 0.473
Post-2024 mean r(stijl,mat): 0.461
Change test (Mann-Whitney): U=9.000, p=0.786
Interpretation: No significant change in stijl-material correlation (U=9.0, p=0.7857)
A significant change in the per-year stijl-material correlation would suggest that the relationship between the two dimensions itself shifted across the break period — e.g., if right-wing parties post-2024 began moderating style while maintaining material impact, the correlation would decrease.
7. Gap Trajectory Interpretation
- Pre-2024 mean gap: 0.813
- Post-2024 mean gap: 0.570
- Gap change: -0.243
A widening gap (increasing material > stylistic) would indicate that right-wing motions became less stylistically extreme but maintained or increased their material impact — consistent with the 'strategic moderation of rhetoric' hypothesis.
A narrowing gap would suggest that stylistic and material dimensions are converging, meaning the distinctions between the two become less meaningful over time.
A stable gap suggests the two dimensions move in parallel, and the flat single-dimension trend is an accurate summary (no masked divergence).
8. Domain Stratification
| Domain | Pre Mean Stijl | Pre Mean Mat | Post Mean Stijl | Post Mean Mat | Pre Gap | Post Gap | Pre r | Post r |
|---|---|---|---|---|---|---|---|---|
| Migration | 2.699 | 3.268 | 2.511 | 3.043 | 0.569 | 0.532 | 0.586 | 0.355 |
| Non-migration | 1.646 | 2.482 | 1.685 | 2.253 | 0.836 | 0.568 | 0.419 | 0.380 |
9. Figure
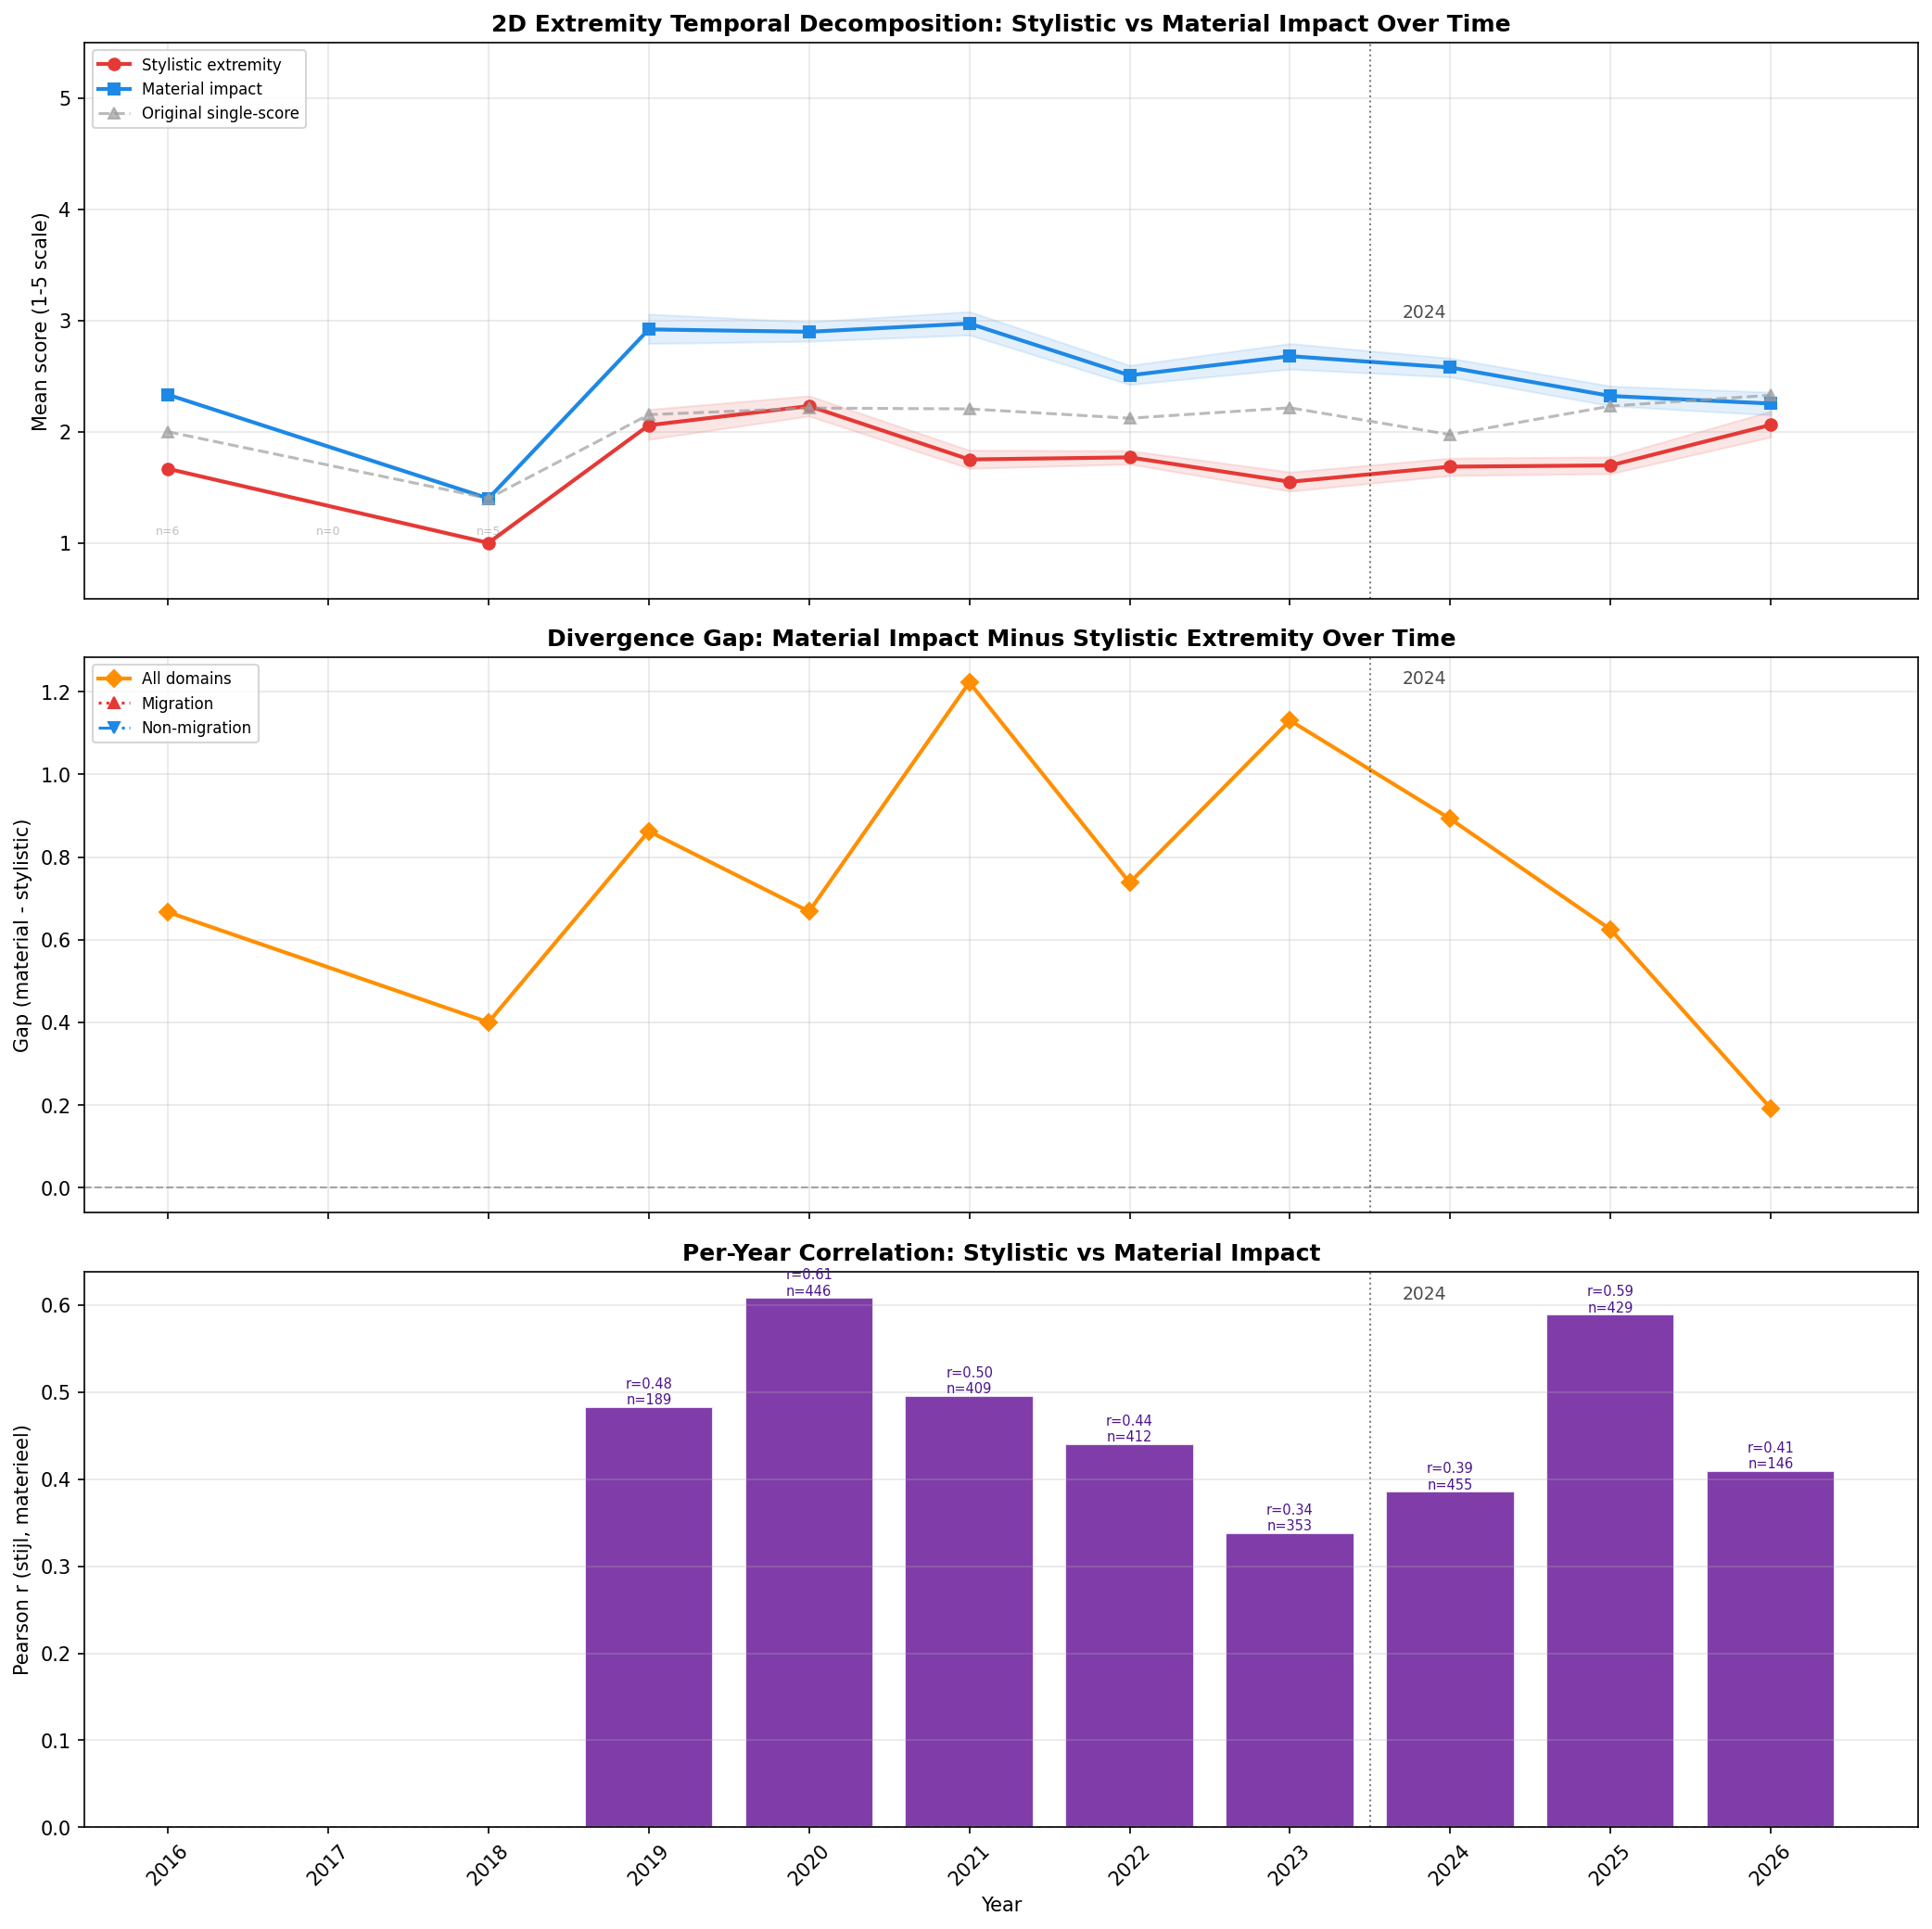
Figure panels:
- Top panel: Yearly mean stylistic (red) and material (blue) extremity scores with
95% bootstrap confidence intervals. Grey dashed line = original single-dimension
text_scorefor comparison. - Middle panel: Gap trajectory (material minus stylistic) for all domains, migration, and non-migration. Positive gap = material impact exceeds stylistic extremity. A widening gap indicates increasing divergence between dimensions.
- Bottom panel: Per-year Pearson correlation between stylistic and material scores. Declining correlation over time suggests the two dimensions are decoupling.
10. Limitations
- Yearly resolution: Year-level aggregation necessarily smooths within-year trends. The quarterly framework from U1 provides finer resolution for other metrics.
- Low-N years: Some years (especially 2016-2018 and 2026) have fewer than 50 scored motions, reducing confidence in those yearly means.
- 2D scores are LLM-generated: The
stijl_extremiteitandmateriele_impactscores come from LLM-based assessment and may contain systematic biases. - Correlation vs causation: Per-year correlations describe association, not causation. A declining correlation could reflect scoring drift rather than genuine decoupling.
- Domain imbalance: Migration-domain motions are a minority of all right-wing motions, so domain-stratified analyses have lower statistical power.
11. Conclusion
The overall stijl-materieel correlation is r=0.470 (p=0.000000), consistent with the aggregate finding of r≈0.47.
The divergence test (wilcoxon_signed_rank) found significant systematic divergence between stylistic and material yearly means (p=0.002).
The pre/post correlation change analysis no significant change in stijl-material correlation (u=9.0, p=0.7857).
The gap (material minus stylistic) narrowed from 0.813 pre-2024 to 0.570 post-2024.