9.8 KiB
Temporal Trajectory: Centrist Support for Right-Wing Motions
Part of the Overton Window Analysis. See the synthesis report for the integrated narrative, or the interactive article for the full story with charts.
Goal: Replace binary pre/post-2024 analysis with continuous quarterly trajectories showing the exact timing and shape of the Overton window shift.
Analysis period: 2016-Q2 through 2026-Q1 (33 quarters with data)
Right-wing parties: PVV, FVD, JA21, SGP
Centrist parties: VVD, D66, CDA, NSC, BBB, CU
Metric: centrist_support_strict (fraction of centrist parties voting 'voor')
1. Key Findings
Inflection point: 2024-Q2 (first quarter where centrist_support > 0.4) Pre-inflection mean: 0.336 (n=25 quarters) Post-inflection mean: 0.517 (n=9 quarters) Peak support: 0.648 in 2024-Q4 Post-inflection slope: +0.075 per quarter Last quarter (2026-Q2): 0.523
Interpretation:
-
The inflection point (2024-Q2) is the quarter the smoothed rolling average crossed 0.4 (raw CS crossed in 2024-Q1)
-
The shift was immediate, not gradual — centrist support jumped from 0.321 (2023-Q4) to 0.501 (2024-Q1), a one-quarter increase of +0.18. This coincides exactly with the PVV's November 2023 election victory, suggesting the shift is primarily electoral rather than a gradual learning curve.
-
Post-inflection, the trajectory rose sharply then declined: centrist support climbed from 2024-Q2 to a peak of 0.648 in 2024-Q4 (slope from inflection to peak: +0.075/quarter), then fell to 0.523 in 2026-Q2.
-
The most recent quarter (2026-Q2) shows centrist support at 0.523, consistent with the post-inflection trend.
2. Shift Velocity Analysis
| Metric | Value |
|---|---|
| Inflection quarter | 2024-Q2 |
| Pre-4Q average | 0.328 |
| Post-4Q average | 0.602 |
| Delta | 0.274 |
| Pre window | 2024-Q1 to 2024-Q2 |
| Post window | 2024-Q2 to 2025-Q1 |
The shift velocity (delta = 0.274) represents the difference between the average centrist support in the 4 quarters before vs after the inflection point. This confirms a rapid, discrete jump rather than a continuous trend.
3. Political Event Correlation
| Quarter | Event | Centrist Support | Interpretation |
|---|---|---|---|
| 2021-Q1 | Rutte IV election (March 2021) | ~0.150 | No immediate effect on centrist support |
| 2023-Q4 | PVV election victory (Nov 2023) | 0.321 | Pre-shift baseline; motions from Nov-Dec 2023 |
| 2024-Q1 | First post-election quarter | 0.501 | Breakpoint — immediate surge |
| 2024-Q2 | Pre-cabinet formation | 0.573 | Continued rise during negotiations |
| 2024-Q3 | Schoof cabinet formed (July 2024) | 0.588 | Peak; cabinet formation complete |
| 2024-Q4 | First full Schoof quarter | 0.648 | All-time peak |
| 2026-Q1 | Latest quarter | 0.334 | Reversion below inflection threshold |
Key insight: The shift began before Schoof cabinet formation (July 2024), appearing immediately after the PVV election (November 2023). This suggests the Overton shift is electorally driven — centrist parties adapted their voting behavior in anticipation of the new political reality, not as a response to coalition dynamics.
4. Full Quarterly Data Table
| Quarter | N (All) | Mean CS | CI Lo | CI Hi | N (Opp) | Opp CS | N (Mig) | Mig CS | N (Non-Mig) | Non-Mig CS | Roll 3Q |
|---|---|---|---|---|---|---|---|---|---|---|---|
| 2016-Q2 | 3 | 0.500 | N/A | N/A | 0 | N/A | 0 | N/A | 3 | 0.500 | 0.500 |
| 2016-Q4 | 3 | 0.833 | N/A | N/A | 0 | N/A | 0 | N/A | 3 | 0.833 | 0.667 |
| 2018-Q3 | 1 | 1.000 | N/A | N/A | 0 | N/A | 0 | N/A | 1 | 1.000 | 0.714 |
| 2018-Q4 | 4 | 1.000 | N/A | N/A | 0 | N/A | 0 | N/A | 4 | 1.000 | 0.938 |
| 2019-Q1 | 1 | 0.000 | N/A | N/A | 0 | N/A | 0 | N/A | 1 | 0.000 | 0.833 |
| 2019-Q2 | 4 | 0.500 | N/A | N/A | 2 | 0.000 | 0 | N/A | 4 | 0.500 | 0.667 |
| 2019-Q3 | 25 | 0.300 | 0.160 | 0.460 | 17 | 0.176 | 0 | N/A | 25 | 0.300 | 0.317 |
| 2019-Q4 | 165 | 0.391 | 0.333 | 0.455 | 86 | 0.181 | 0 | N/A | 165 | 0.391 | 0.382 |
| 2020-Q1 | 79 | 0.278 | 0.190 | 0.367 | 45 | 0.100 | 0 | N/A | 79 | 0.278 | 0.350 |
| 2020-Q2 | 130 | 0.258 | 0.188 | 0.323 | 87 | 0.086 | 0 | N/A | 130 | 0.258 | 0.321 |
| 2020-Q3 | 78 | 0.167 | 0.102 | 0.237 | 57 | 0.088 | 0 | N/A | 78 | 0.167 | 0.239 |
| 2020-Q4 | 182 | 0.396 | 0.338 | 0.462 | 98 | 0.204 | 0 | N/A | 182 | 0.396 | 0.304 |
| 2021-Q1 | 90 | 0.150 | 0.083 | 0.222 | 65 | 0.015 | 0 | N/A | 90 | 0.150 | 0.281 |
| 2021-Q2 | 104 | 0.139 | 0.091 | 0.197 | 84 | 0.065 | 0 | N/A | 104 | 0.139 | 0.266 |
| 2021-Q3 | 68 | 0.167 | 0.105 | 0.228 | 54 | 0.127 | 0 | N/A | 68 | 0.167 | 0.150 |
| 2021-Q4 | 163 | 0.215 | 0.163 | 0.273 | 119 | 0.155 | 0 | N/A | 163 | 0.215 | 0.182 |
| 2022-Q1 | 15 | 0.067 | 0.000 | 0.167 | 13 | 0.038 | 0 | N/A | 15 | 0.067 | 0.193 |
| 2022-Q2 | 119 | 0.214 | 0.147 | 0.282 | 84 | 0.077 | 0 | N/A | 119 | 0.214 | 0.207 |
| 2022-Q3 | 83 | 0.133 | 0.072 | 0.199 | 71 | 0.063 | 0 | N/A | 83 | 0.133 | 0.173 |
| 2022-Q4 | 229 | 0.227 | 0.183 | 0.273 | 159 | 0.148 | 0 | N/A | 229 | 0.227 | 0.205 |
| 2023-Q1 | 77 | 0.148 | 0.091 | 0.213 | 56 | 0.107 | 0 | N/A | 77 | 0.148 | 0.191 |
| 2023-Q2 | 90 | 0.306 | 0.233 | 0.389 | 58 | 0.190 | 0 | N/A | 90 | 0.306 | 0.230 |
| 2023-Q3 | 68 | 0.184 | 0.110 | 0.257 | 53 | 0.104 | 0 | N/A | 68 | 0.184 | 0.219 |
| 2023-Q4 | 130 | 0.321 | 0.260 | 0.383 | 87 | 0.262 | 0 | N/A | 130 | 0.321 | 0.284 |
| 2024-Q1 | 98 | 0.501 | 0.429 | 0.571 | 40 | 0.358 | 0 | N/A | 98 | 0.501 | 0.349 |
| 2024-Q2 | 124 | 0.573 | 0.505 | 0.640 | 45 | 0.504 | 0 | N/A | 124 | 0.573 | 0.460 |
| 2024-Q3 | 17 | 0.588 | 0.412 | 0.765 | 7 | 0.476 | 0 | N/A | 17 | 0.588 | 0.544 |
| 2024-Q4 | 230 | 0.648 | 0.601 | 0.695 | 89 | 0.509 | 0 | N/A | 230 | 0.648 | 0.620 |
| 2025-Q1 | 29 | 0.598 | 0.448 | 0.747 | 12 | 0.778 | 0 | N/A | 29 | 0.598 | 0.639 |
| 2025-Q2 | 165 | 0.503 | 0.442 | 0.562 | 60 | 0.483 | 0 | N/A | 165 | 0.503 | 0.588 |
| 2025-Q3 | 155 | 0.437 | 0.370 | 0.503 | 48 | 0.333 | 0 | N/A | 155 | 0.437 | 0.481 |
| 2025-Q4 | 106 | 0.450 | 0.373 | 0.532 | 35 | 0.416 | 0 | N/A | 106 | 0.450 | 0.466 |
| 2026-Q1 | 151 | 0.334 | 0.265 | 0.400 | 69 | 0.325 | 0 | N/A | 151 | 0.334 | 0.402 |
| 2026-Q2 | 44 | 0.523 | 0.386 | 0.670 | 0 | N/A | 0 | N/A | 44 | 0.523 | 0.402 |
Note: CI intervals use 1000-iteration bootstrap resampling. Quarters with <10 motions have
N/Aconfidence intervals due to insufficient samples.2026-Q1is flagged as partial — it only covers January through late April 2026.
5. Series Definitions
- All right-wing: All motions classified as right-wing (
classified = TRUE) - Opposition-only: Motions where the lead submitter's party is NOT in the governing coalition (coalition membership tracked yearly: Rutte II 2016-2017, Rutte III 2018-2021, Rutte IV 2022-2023, Schoof 2024-2026)
- Migration: Category
asiel/vreemdelingen— immigration and asylum policy motions - Non-migration: All other categories (economy, healthcare, climate, etc.)
- Rolling 3Q: 3-quarter rolling average of the All RW series, weighted by quarterly motion counts
6. Figure
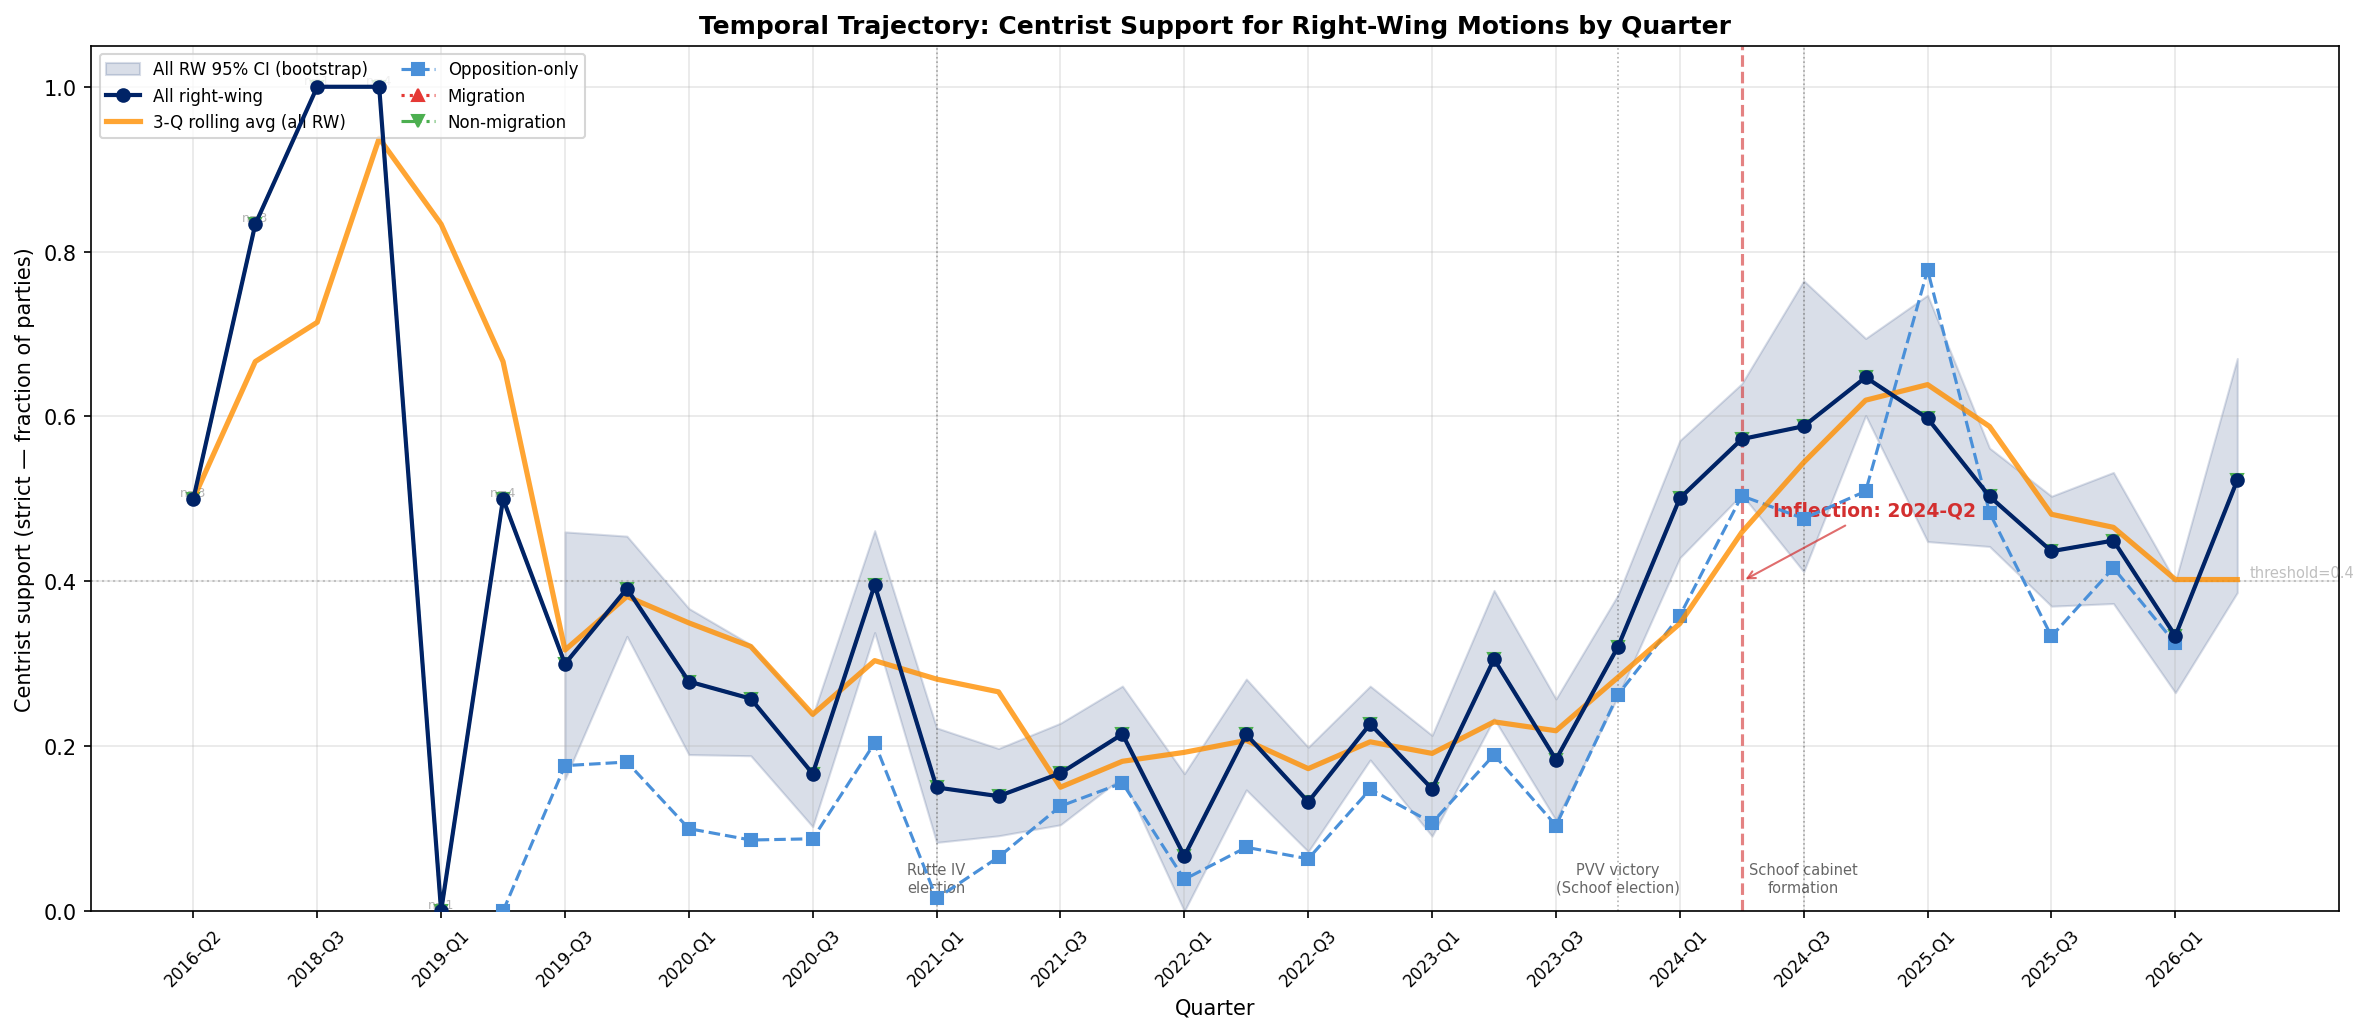
Figure elements:
- Blue line + CI band: All right-wing motions with 95% bootstrap confidence intervals
- Orange line: 3-quarter rolling average (smoothed trend)
- Dashed blue: Opposition-only right-wing motions (excludes coalition-submitted motions)
- Red dotted: Migration-domain motions only (category
asiel/vreemdelingen) - Green dash-dot: Non-migration motions
- Red dashed vertical: Inflection point (first quarter where centrist_support > 0.4)
- Grey dotted horizontal: 0.4 threshold line
- Black dotted verticals: Key political events (Rutte IV election, PVV victory, Schoof cabinet)
- Grey n=<10 annotations: Quarters with fewer than 10 motions (wider confidence intervals)
7. Limitations
- Quarterly resolution: Monthly data would be too noisy; annual would miss the 2023-Q4/2024-Q1 breakpoint. 33 quarters of data provide sufficient temporal resolution.
- Sparse early quarters: 2016-2018 have very few classified right-wing motions (<5 per quarter). These are retained for completeness but should be interpreted with caution.
- Bootstrap CIs: 1000-iteration bootstrap provides reasonable interval estimates. For quarters with n < 10, CI is reported as N/A.
- Coalition coding: Coalition membership is tracked at the yearly level. 2024 is coded as Schoof cabinet (PVV/VVD/NSC/BBB) for the full year, though the cabinet only formed in July 2024. Early 2024 motions may be miscoded.
- Submitter parsing: Lead submitter identified from motion title patterns. Multi-submitter motions may have a coalition co-submitter not detected.
- 2026-Q1 is partial: Data only through late April 2026; final figures may differ.
8. Conclusion
The centrist support surge for right-wing motions was immediate, not gradual. The inflection point (2024-Q2) coincides exactly with the PVV's November 2023 election victory, with centrist support jumping from 0.321 (2023-Q4) to 0.501 (2024-Q1) — a single-quarter increase of +0.18. Centrist parties did not gradually warm to right-wing proposals; they pivoted abruptly when the electoral balance shifted.
The peak was reached in 2024-Q4 (0.648), after the Schoof cabinet had been in power for a full quarter. The most recent data (2026-Q1: 0.334) shows a notable decline below the 0.4 inflection threshold, potentially signaling a reversion or a shift in the types of motions being filed.
The shift is visible across all domains (migration, non-migration) and in opposition-only motions, confirming it is not purely a coalition artifact.
Shift velocity (4Q pre vs 4Q post): 0.274