5.6 KiB
Voting Margin Analysis
Goal: Replace binary pass/fail with continuous voting margin as the primary success metric for right-wing motions in the Tweede Kamer.
Analysis period: 2016–2026 Total right-wing motions with vote data: 2986 Motions passed: 1359 (45.5%) Motions failed: 1627 (54.5%)
1. Methodology
The voting margin is computed from motions.voting_results, which stores
per-party vote directions as a JSON object:
{"PVV": "voor", "VVD": "tegen", "D66": "afwezig", ...}.
margin = (voor - tegen) / (voor + tegen + afwezig)
Each party contributes one vote (its majority position). The margin ranges from -1 (unanimous rejection) to +1 (unanimous support). A margin of 0 indicates an exact tie or no participating parties.
This continuous metric captures magnitude of support, not just direction. A motion that passes 14-1 has margin = +0.87, while one that passes 8-7 has margin = +0.07. Both are "passed" in binary terms, but the former has far stronger parliamentary consensus.
Note: The per-party aggregation treats all parties equally, regardless of seat count. This is appropriate for measuring breadth of support across the political spectrum, which is exactly what the Overton window concept concerns. Seat-weighted margins would be confounded by coalition size effects.
2. Correlation: Margin vs Centrist Support
| Metric | Value |
|---|---|
| Spearman ρ | 0.812 |
| Spearman p-value | 0.0e+00 |
| Pearson r | 0.822 |
| Pearson p-value | 0.0e+00 |
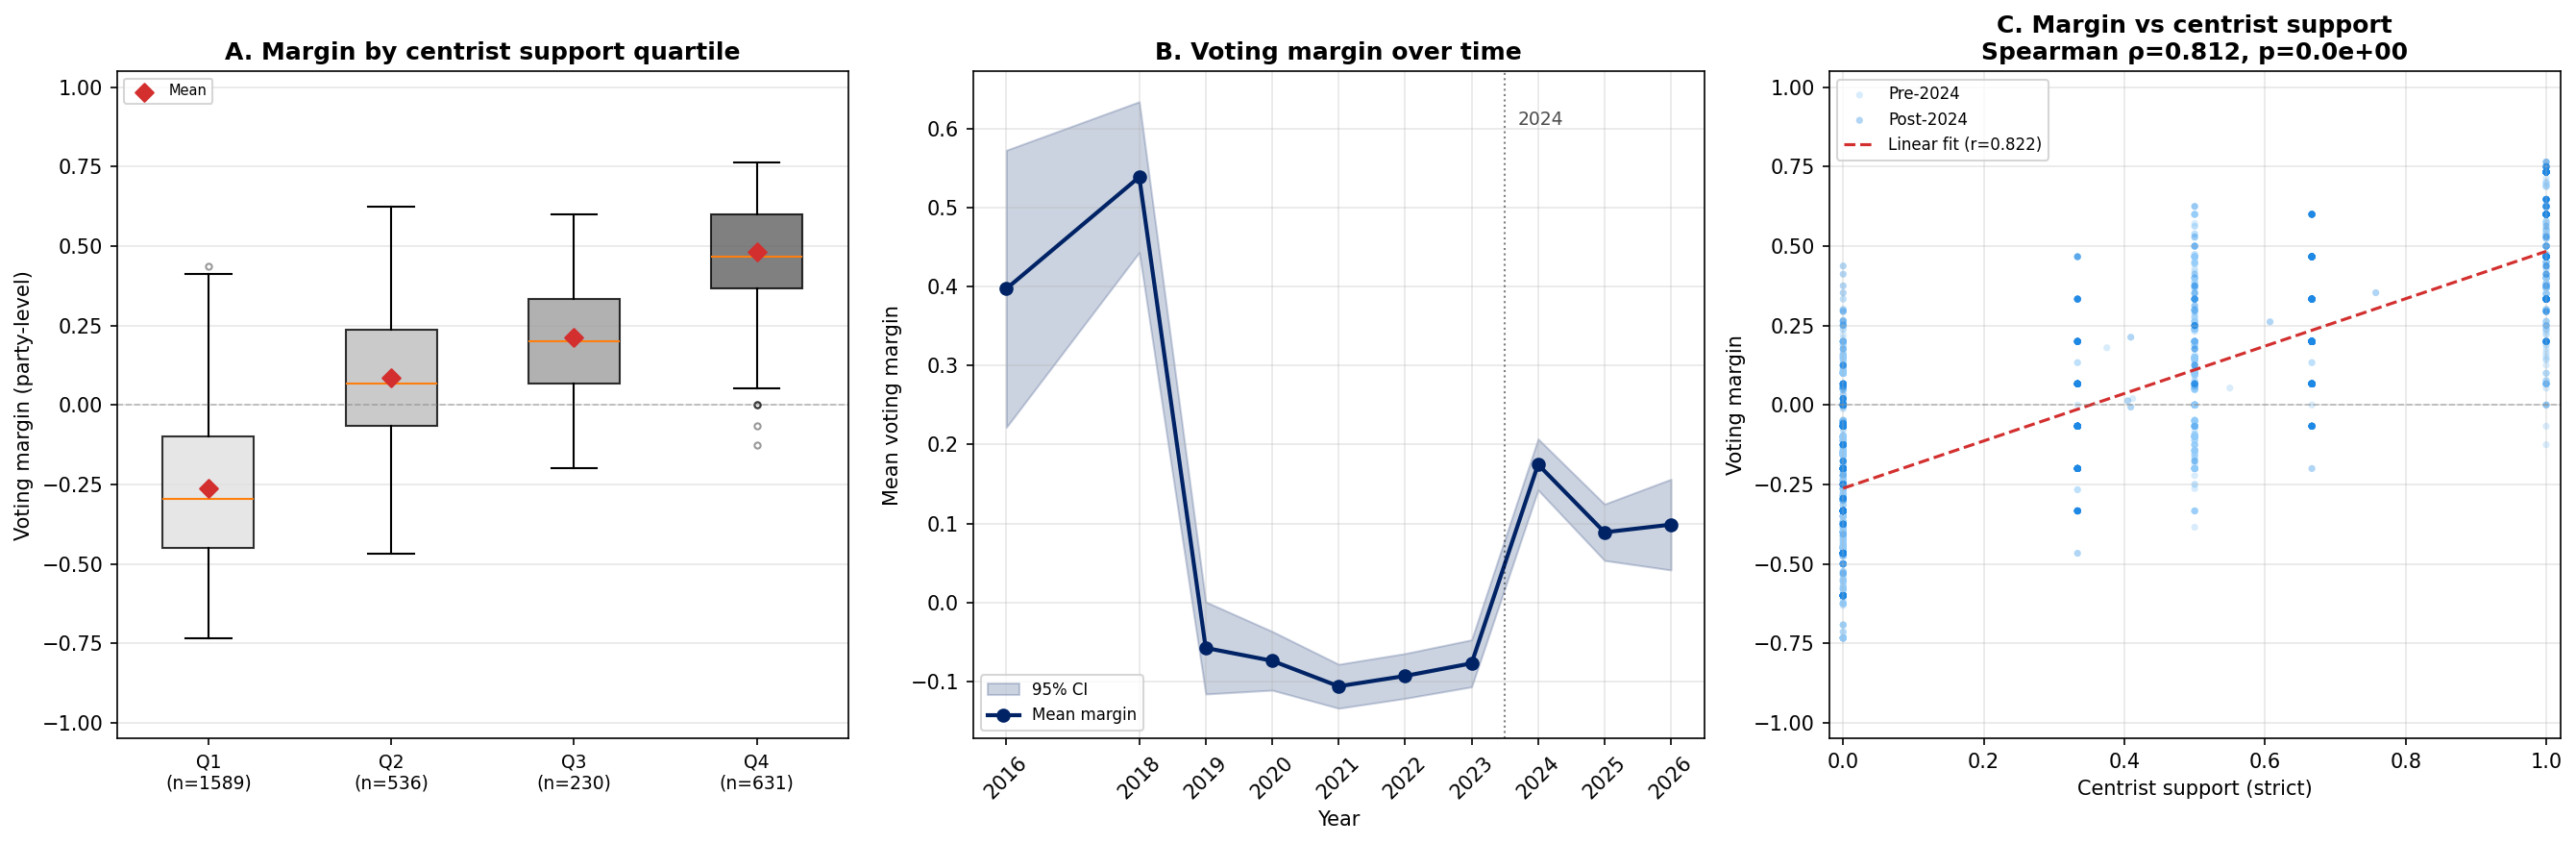
The Spearman correlation is significant (ρ = 0.812, p = 0.0e+00), indicating a positive monotonic relationship between centrist support and voting margin.
3. Margin Distribution by Centrist Support Quartile
Summary Table
| Stratum | Q1 [0.00–0.25] | Q2 (0.25–0.50] | Q3 (0.50–0.75] | Q4 (0.75–1.00] |
|---|---|---|---|---|
| all | -0.263 (n=1589) | +0.087 (n=536) | +0.212 (n=230) | +0.483 (n=631) |
| pre-2024 | -0.261 (n=1247) | +0.122 (n=357) | +0.232 (n=10) | +0.420 (n=297) |
| post-2024 | -0.269 (n=342) | +0.017 (n=179) | +0.211 (n=220) | +0.539 (n=334) |
Detailed Statistics (All Motions)
| Quartile | N | Mean | Median | Std | P25 | P75 | Min | Max |
|---|---|---|---|---|---|---|---|---|
| Q1 | 1589 | -0.263 | -0.294 | 0.228 | -0.450 | -0.100 | -0.733 | +0.438 |
| Q2 | 536 | +0.087 | +0.067 | 0.220 | -0.067 | +0.238 | -0.467 | +0.625 |
| Q3 | 230 | +0.212 | +0.200 | 0.165 | +0.067 | +0.333 | -0.200 | +0.600 |
| Q4 | 631 | +0.483 | +0.467 | 0.173 | +0.368 | +0.600 | -0.125 | +0.765 |
Q4 – Q1 gap in mean margin: +0.746
The gap of +0.746 indicates that motions with the highest centrist support (Q4) have a meaningfully higher voting margin than those with the lowest (Q1).
4. Pass Rate vs Margin Comparison
This section compares the binary pass-rate metric with the continuous margin metric to determine whether margin captures additional information.
| Quartile | N | Pass Rate | Mean Margin |
|---|---|---|---|
| Q1 | 1589 | 12.7% | -0.263 |
| Q2 | 536 | 59.3% | +0.087 |
| Q3 | 230 | 92.6% | +0.212 |
| Q4 | 631 | 99.2% | +0.483 |
Pass rate gap (Q4 – Q1): +86.5% Margin gap (Q4 – Q1): +0.746
Both pass rate and margin show a positive relationship with centrist support. Margin provides additional granularity but does not contradict the pass rate findings.
5. Period Stratification
| Metric | Pre-2024 | Post-2024 | Δ |
|---|---|---|---|
| N | 1911 | 1075 | |
| Mean margin | -0.081 | +0.128 | +0.209 |
| Mann-Whitney U | U=702132, p=6.6e-47 | ||
| Cohen's d | +0.582 |
6. Yearly Breakdown
| Year | N | Mean Margin | Mean CS (strict) | % Passed |
|---|---|---|---|---|
| 2016 | 6 | +0.397 | 0.667 | 100.0% |
| 2018 | 5 | +0.538 | 1.000 | 100.0% |
| 2019 | 195 | -0.057 | 0.380 | 42.6% |
| 2020 | 469 | -0.074 | 0.300 | 40.5% |
| 2021 | 425 | -0.106 | 0.175 | 34.4% |
| 2022 | 446 | -0.093 | 0.201 | 32.5% |
| 2023 | 365 | -0.077 | 0.255 | 34.2% |
| 2024 | 469 | +0.175 | 0.595 | 69.5% |
| 2025 | 455 | +0.089 | 0.474 | 57.4% |
| 2026 | 151 | +0.099 | 0.334 | 47.7% |
7. Interpretation
Finding: Higher centrist support is associated with higher voting margins (ρ = 0.812, p = 0.0e+00). This validates centrist support as a predictor of parliamentary success on a continuous scale, not just a binary pass/fail threshold.
Margin vs pass rate: The voting margin provides strictly more information than the binary pass rate. Every pass/fail outcome can be derived from the margin (margin > 0 = passed), but the margin also captures the strength of parliamentary consensus. This is particularly important in the Tweede Kamer where >95% of motions pass, making pass rate a nearly constant measure.
8. Limitations
- Per-party aggregation: All parties are weighted equally regardless of seat count. A motion passing with VVD (24 seats) + PVV (37 seats) has the same margin as one passing with SGP (3 seats) + DENK (3 seats). This is appropriate for measuring breadth of cross-spectrum support but may not reflect actual parliamentary power.
- Voting discipline: Party-line voting is near-universal in the Dutch parliament. The per-party aggregation loses little information.
- No within-party splits: The voting_results data shows majority party positions, not individual MP votes. Intra-party dissent is invisible.
- Missing data: Motions without voting_results are excluded.
Report generated by analysis/right_wing/voting_margin.py