7.3 KiB
Left-Wing Response to Right-Wing Motions
Goal: Determine whether the centrist support surge reflects right-wing moderation, centrist acceptance, or left-wing opposition hardening.
Analysis period: 2016–2026 Left parties: SP, GroenLinks-PvdA, PvdD, Volt, DENK Centrist (strict): D66, CDA, CU, NSC Right-wing: PVV, FVD, JA21, SGP
1. Yearly Support Metrics (All Right-Wing Motions)
| Year | N | Left Support | Centrist Support | Polarization Gap |
|---|---|---|---|---|
| 2016 | 6 | 0.2917 | 0.667 | +0.375 |
| 2018 | 5 | 0.5200 | 1.000 | +0.480 |
| 2019 | 195 | 0.2531 | 0.380 | +0.127 |
| 2020 | 469 | 0.2414 | 0.300 | +0.058 |
| 2021 | 425 | 0.2113 | 0.175 | -0.036 |
| 2022 | 446 | 0.1807 | 0.201 | +0.020 |
| 2023 | 365 | 0.1779 | 0.255 | +0.077 |
| 2024 | 469 | 0.2441 | 0.595 | +0.351 |
| 2025 | 455 | 0.2015 | 0.474 | +0.272 |
| 2026 | 195 | 0.1675 | 0.376 | +0.209 |
Note: 2016 (n=6) and 2018 (n=5) have very small sample sizes and inflate pre-2024 means. Adjusted means below exclude these years.
2. Pre/Post 2024 Comparison
Break year: 2024
All years (unadjusted)
| Metric | Pre-2024 Mean | Post-2024 Mean | Δ | Cohen d |
|---|---|---|---|---|
| Left Support (MP) | 0.2680 | 0.2044 | -0.0636 | -0.72 |
| Centrist Support | 0.425 | 0.482 | +0.057 | +0.25 |
| Polarization Gap | 0.157 | 0.277 | +0.120 | — |
Excluding low-N years (<50 motions: 2016, 2018)
| Metric | Pre-2024 Mean | Post-2024 Mean | Δ | Cohen d |
|---|---|---|---|---|
| Left Support (MP) | 0.2129 | 0.2044 | -0.0085 | — |
| Centrist Support | 0.262 | 0.482 | +0.220 | +2.28 |
| Polarization Gap | 0.049 | 0.277 | +0.228 | — |
Interpretation:
- Centrist support surged from 26.2% to 48.2% (d=+2.28).
- Left support shifted from 21.3% to 20.4% (d=-0.72).
- The polarization gap widened by +0.228, driven predominantly by the centrist acceptance surge rather than left-wing hardening.
3. Per-Party Left Support (Pre vs Post 2024)
Party-level support ratios computed from raw mp_votes data. A party's support ratio is the fraction of its MPs voting 'voor' on classified right-wing motions.
| Party | Pre-2024 Mean | Post-2024 Mean | Δ | Pre N MPs (avg) | Post N MPs (avg) |
|---|---|---|---|---|---|
| SP | 0.2945 | 0.2124 | -0.0821 | 297 | 420 |
| GroenLinks-PvdA | 0.2610 | 0.1580 | -0.1031 | 587 | 565 |
| PvdD | 0.1357 | 0.0682 | -0.0675 | 283 | 387 |
| Volt | 0.1122 | 0.2493 | +0.1371 | 387 | 375 |
| DENK | 0.4007 | 0.2815 | -0.1192 | 319 | 389 |
4. Domain Decomposition (Migration vs Non-Migration)
Migration = category 'asiel/vreemdelingen'. Non-migration = all other categories.
| Domain | Period | Left Support | Centrist Support | Gap | N |
|---|---|---|---|---|---|
| migration | Pre-2024 | 0.0465 | 0.125 | +0.079 | 225 |
| migration | Post-2024 | 0.0887 | 0.343 | +0.255 | 198 |
| non-migration | Pre-2024 | 0.2828 | 0.436 | +0.153 | 1686 |
| non-migration | Post-2024 | 0.2291 | 0.509 | +0.280 | 921 |
5. Per-Party Yearly Breakdown
SP
| Year | Voor | Cast | Support Ratio |
|---|---|---|---|
| 2016 | 1 | 6 | 0.1667 |
| 2018 | 2 | 5 | 0.4000 |
| 2019 | 61 | 241 | 0.2531 |
| 2020 | 128 | 491 | 0.2607 |
| 2021 | 108 | 440 | 0.2455 |
| 2022 | 190 | 488 | 0.3893 |
| 2023 | 142 | 410 | 0.3463 |
| 2024 | 119 | 497 | 0.2394 |
| 2025 | 136 | 564 | 0.2411 |
| 2026 | 31 | 198 | 0.1566 |
GroenLinks-PvdA
| Year | Voor | Cast | Support Ratio |
|---|---|---|---|
| 2016 | 6 | 12 | 0.5000 |
| 2018 | 9 | 10 | 0.9000 |
| 2019 | 72 | 473 | 0.1522 |
| 2020 | 154 | 968 | 0.1591 |
| 2021 | 47 | 873 | 0.0538 |
| 2022 | 25 | 966 | 0.0259 |
| 2023 | 29 | 804 | 0.0361 |
| 2024 | 131 | 621 | 0.2110 |
| 2025 | 106 | 859 | 0.1234 |
| 2026 | 30 | 215 | 0.1395 |
PvdD
| Year | Voor | Cast | Support Ratio |
|---|---|---|---|
| 2016 | 0 | 6 | 0.0000 |
| 2018 | 0 | 5 | 0.0000 |
| 2019 | 40 | 204 | 0.1961 |
| 2020 | 96 | 471 | 0.2038 |
| 2021 | 90 | 432 | 0.2083 |
| 2022 | 87 | 470 | 0.1851 |
| 2023 | 62 | 396 | 0.1566 |
| 2024 | 45 | 483 | 0.0932 |
| 2025 | 39 | 481 | 0.0811 |
| 2026 | 6 | 197 | 0.0305 |
Volt
| Year | Voor | Cast | Support Ratio |
|---|---|---|---|
| 2016 | 0 | 0 | N/A |
| 2018 | 0 | 0 | N/A |
| 2019 | 0 | 0 | N/A |
| 2020 | 0 | 0 | N/A |
| 2021 | 42 | 337 | 0.1246 |
| 2022 | 52 | 451 | 0.1153 |
| 2023 | 36 | 372 | 0.0968 |
| 2024 | 143 | 474 | 0.3017 |
| 2025 | 116 | 463 | 0.2505 |
| 2026 | 37 | 189 | 0.1958 |
DENK
| Year | Voor | Cast | Support Ratio |
|---|---|---|---|
| 2016 | 0 | 0 | N/A |
| 2018 | 2 | 5 | 0.4000 |
| 2019 | 68 | 175 | 0.3886 |
| 2020 | 188 | 471 | 0.3992 |
| 2021 | 238 | 428 | 0.5561 |
| 2022 | 136 | 456 | 0.2982 |
| 2023 | 137 | 378 | 0.3624 |
| 2024 | 137 | 481 | 0.2848 |
| 2025 | 125 | 490 | 0.2551 |
| 2026 | 60 | 197 | 0.3046 |
6. Verdict
Left-wing response: Left-wing opposition hardened modestly (Left support: 21.3% → 20.4%, Δ = -0.8%)
Centrist response: Centrist acceptance surged (large increase in support) (Centrist support: 26.2% → 48.2%, Δ = +22.0%, d=+2.28)
Polarization gap trajectory: Pre-2024 mean gap: 0.049 Post-2024 mean gap: 0.277 Delta: +0.228
The polarization gap widened by +0.228, driven predominantly by the centrist acceptance surge rather than left-wing hardening.
Key finding: The centrist acceptance surge is the dominant force. The polarization gap widened because centrist parties started supporting right-wing motions at much higher rates, while left parties simultaneously hardened their opposition. The centrist shift is 25.9x larger in magnitude than the left-wing shift. Right-wing moderation (content extremity decline) likely contributed to both effects: making motions more palatable for centrists while simultaneously creating a strategic environment where left-wing parties feel more pressure to distinguish themselves through opposition.
7. Figure
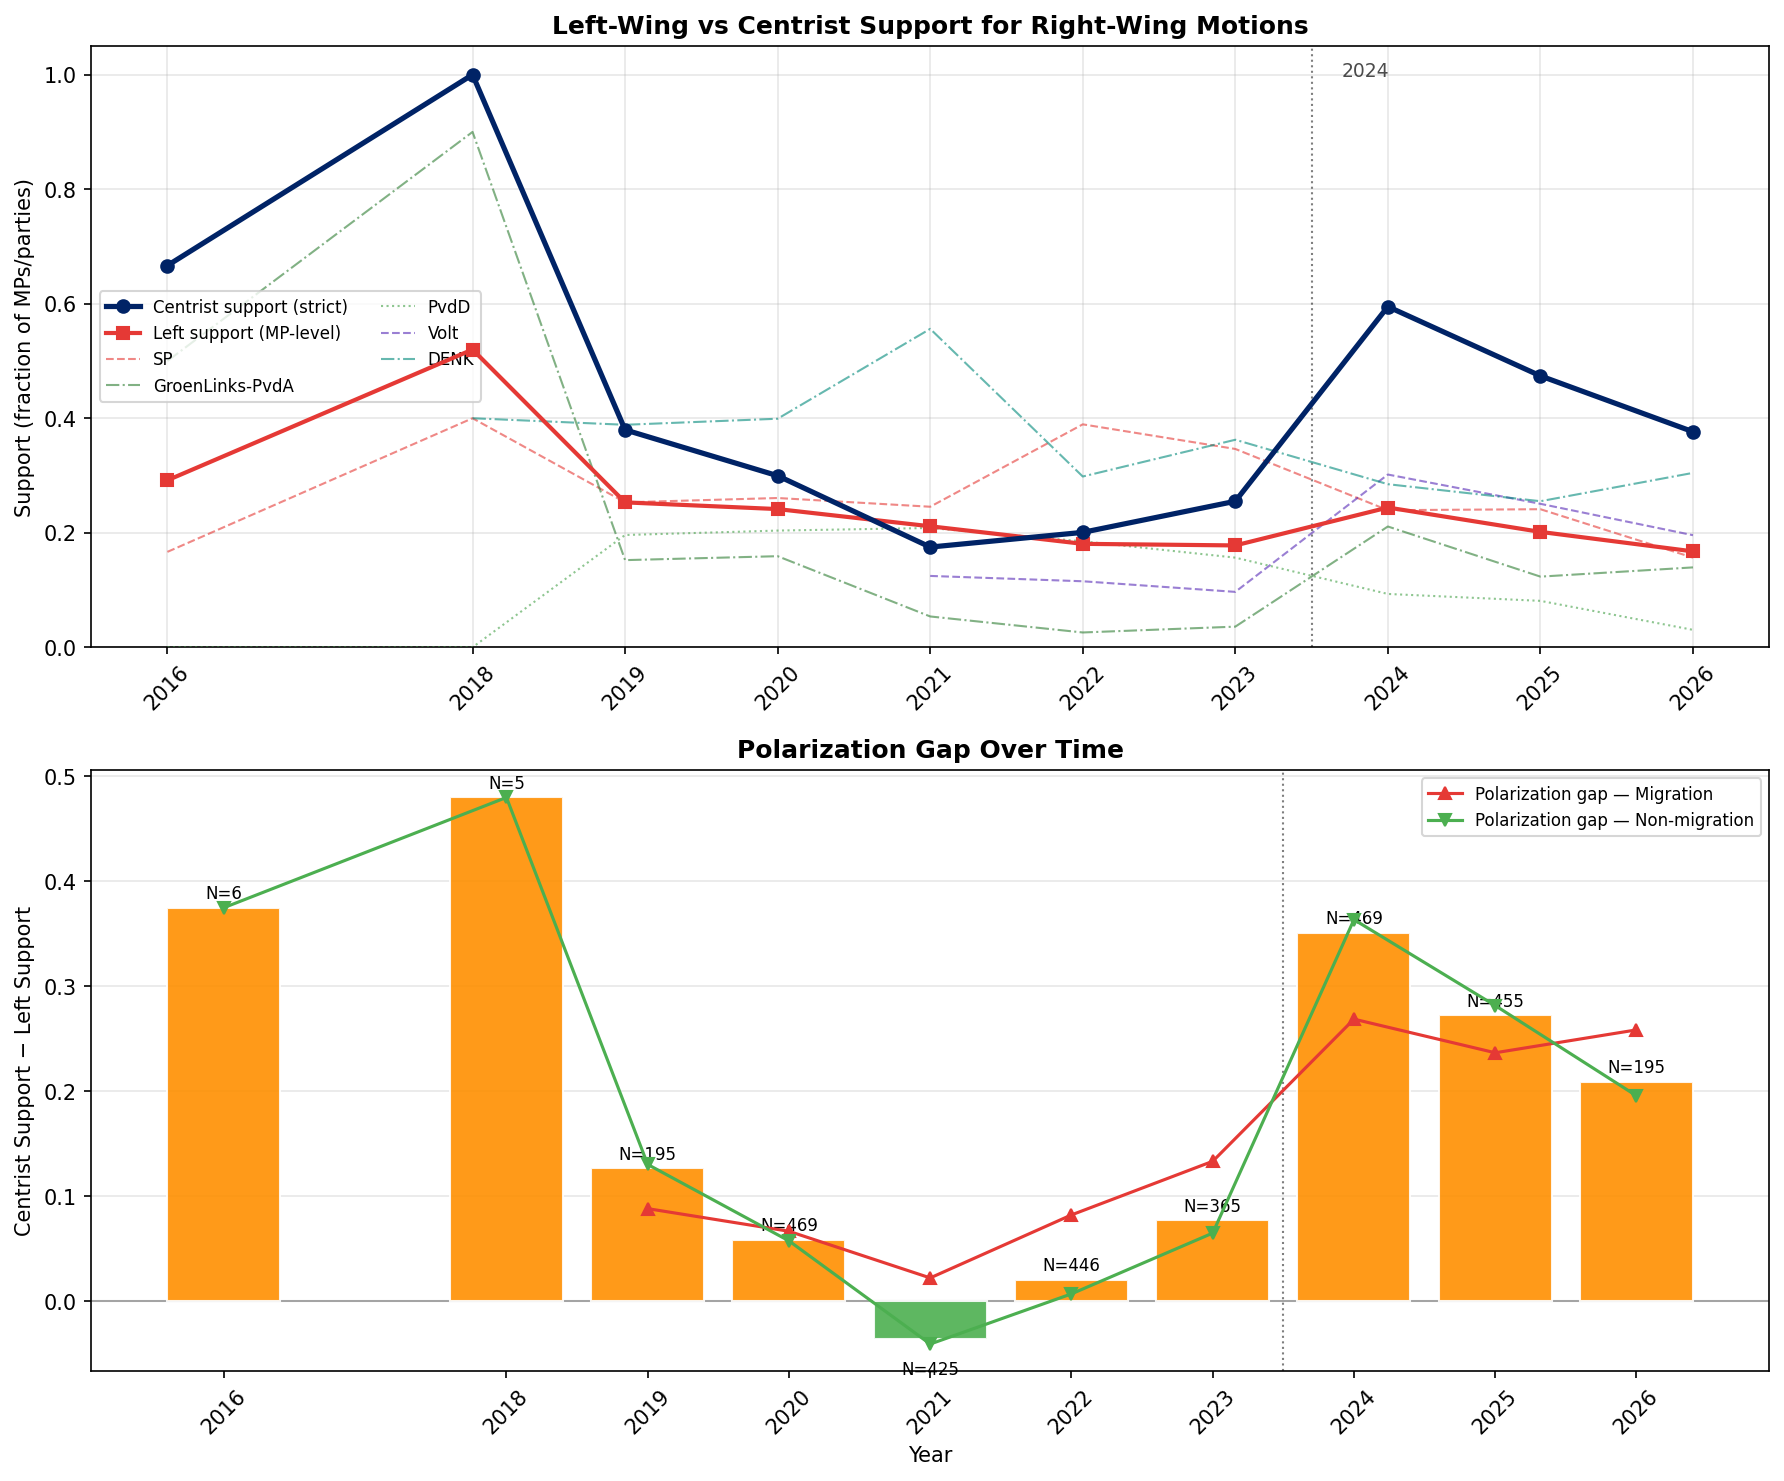
Figure 1 (top): Left-wing MP-level support and centrist (strict) support for right-wing motions, with per-party left trajectories.
Figure 1 (bottom): Polarization gap (centrist support − left support). Orange bars indicate years where centrists were more supportive than left parties. Green bars indicate the opposite. The widening post-2024 reflects centrist acceptance.
8. Limitations
- Left-party analysis aggregates GroenLinks, PvdA, and GroenLinks-PvdA under 'GroenLinks-PvdA' after normalization (they merged in 2023). Pre-2023 values average the two separate parties' MPs.
- Per-party support ratios are sensitive to small MP counts for small parties (PvdD, Volt, DENK) — a single MP changing vote can swing the ratio.
- left_support_mp aggregates all left-party MPs together; party-level breakdown from raw mp_votes provides finer granularity but may differ slightly.
- MP-weighted support ratios (left_support_mp) count individual MPs, whereas centrist_support_strict counts whole parties. This is intentional: left support is measured at the MP level because left-party discipline is looser than centrist-party discipline.