11 KiB
2D Extremity Temporal Decomposition
Goal: Test whether the "flat single-dimension trend" masks diverging trajectories when stylistic and material extremity scores are analyzed separately over time.
Analysis period: 2016-2026
Data source (right-wing): extremity_scores_2d (2,869 motions scored) joined with right_wing_motions
Data source (all motions): extremity_scores_all (29,570 motions scored) joined with motions
Domains: Migration = asiel/vreemdelingen; Non-migration = all other categories
*Years with <50 scored motions are flagged for low confidence.
1. Key Findings
Overall correlation r(stijl, materieel): 0.472 (p=0.000000) Migration domain r(stijl, materieel): 0.471 (p=0.000000, n=423) Non-migration domain r(stijl, materieel): 0.424 (p=0.000000, n=2607)
2. Pre/Post 2024 Comparison
| Dimension | Pre-2024 Mean | Post-2024 Mean | Δ |
|---|---|---|---|
| Stylistic extremity | 1.725 | 1.797 | 0.072 |
| Material impact | 2.535 | 2.440 | -0.095 |
| Text score (original) | 2.063 | 2.190 | 0.127 |
| Gap (M-S) | 0.810 | 0.643 | -0.167 |
3. Yearly Data Table
| Year | N | Stylistic | Material | Text (orig) | Gap (M-S) | N Mig | Styl Mig | Mat Mig | N Non-Mig | Styl NM | Mat NM | r(stijl,mat) |
|---|---|---|---|---|---|---|---|---|---|---|---|---|
| 2016 * | 6 | 1.667 | 2.333 | 2.000 | 0.667 | 0 | N/A | N/A | 6 | 1.667 | 2.333 | N/A |
| 2017 * | 0 | N/A | N/A | N/A | N/A | 0 | N/A | N/A | 0 | N/A | N/A | N/A |
| 2018 * | 5 | 1.000 | 1.400 | 1.400 | 0.400 | 0 | N/A | N/A | 5 | 1.000 | 1.400 | N/A |
| 2019 | 195 | 2.046 | 2.913 | 2.138 | 0.867 | 17 | 2.941 | 2.824 | 178 | 1.961 | 2.921 | 0.491 |
| 2020 | 469 | 2.228 | 2.906 | 2.262 | 0.678 | 36 | 3.389 | 3.472 | 433 | 2.132 | 2.859 | 0.603 |
| 2021 | 425 | 1.755 | 2.976 | 2.240 | 1.221 | 30 | 2.967 | 3.833 | 395 | 1.663 | 2.911 | 0.503 |
| 2022 | 446 | 1.800 | 2.525 | 2.161 | 0.724 | 77 | 2.260 | 3.026 | 369 | 1.705 | 2.420 | 0.429 |
| 2023 | 365 | 1.575 | 2.690 | 2.238 | 1.115 | 65 | 2.231 | 3.308 | 300 | 1.433 | 2.557 | 0.346 |
| 2024 | 469 | 1.680 | 2.582 | 1.985 | 0.902 | 63 | 2.571 | 3.175 | 406 | 1.542 | 2.490 | 0.391 |
| 2025 | 455 | 1.695 | 2.332 | 2.253 | 0.637 | 94 | 2.543 | 3.277 | 361 | 1.474 | 2.086 | 0.592 |
| 2026 | 195 | 2.015 | 2.405 | 2.331 | 0.390 | 41 | 2.707 | 2.927 | 154 | 1.831 | 2.266 | 0.335 |
- Years with <50 scored motions; confidence intervals are wider or N/A.
4. Divergence Test (Wilcoxon Signed-Rank)
Test: wilcoxon_signed_rank
Statistic: 0.0
p-value: 0.001953125
N yearly pairs: 10
Conclusion: Significant divergence: material and stylistic yearly means differ (W=0.0, p=0.0020)
The Wilcoxon signed-rank test compares yearly mean stylistic vs yearly mean material scores. A significant result (p < 0.05) indicates the two dimensions systematically differ, meaning the flat single-dimension trend masks a genuine divergence between stylistic and material extremity.
5. Per-Year Correlation Analysis
| Year | r(stijl,mat) | p | N | Domain |
|---|---|---|---|---|
| 2016 | N/A | N/A | 6 | All |
| 2017 | N/A | N/A | 0 | All |
| 2018 | N/A | N/A | 5 | All |
| 2019 | 0.491 | 0.000000 | 195 | All |
| 0.769 | 0.000313 | 17 | Migration | |
| 0.500 | 0.000000 | 178 | Non-migration | |
| 2020 | 0.603 | 0.000000 | 469 | All |
| 0.352 | 0.035486 | 36 | Migration | |
| 0.604 | 0.000000 | 433 | Non-migration | |
| 2021 | 0.503 | 0.000000 | 425 | All |
| 0.600 | 0.000460 | 30 | Migration | |
| 0.455 | 0.000000 | 395 | Non-migration | |
| 2022 | 0.429 | 0.000000 | 446 | All |
| 0.557 | 0.000000 | 77 | Migration | |
| 0.327 | 0.000000 | 369 | Non-migration | |
| 2023 | 0.346 | 0.000000 | 365 | All |
| 0.487 | 0.000039 | 65 | Migration | |
| 0.218 | 0.000146 | 300 | Non-migration | |
| 2024 | 0.391 | 0.000000 | 469 | All |
| 0.155 | 0.224438 | 63 | Migration | |
| 0.355 | 0.000000 | 406 | Non-migration | |
| 2025 | 0.592 | 0.000000 | 455 | All |
| 0.561 | 0.000000 | 94 | Migration | |
| 0.378 | 0.000000 | 361 | Non-migration | |
| 2026 | 0.335 | 0.000002 | 195 | All |
| 0.536 | 0.000308 | 41 | Migration | |
| 0.098 | 0.227990 | 154 | Non-migration |
6. Correlation Change Pre vs Post 2024
Pre-2024 mean r(stijl,mat): 0.475
Post-2024 mean r(stijl,mat): 0.439
Change test (Mann-Whitney): U=10.000, p=0.571
Interpretation: No significant change in stijl-material correlation (U=10.0, p=0.5714)
A significant change in the per-year stijl-material correlation would suggest that the relationship between the two dimensions itself shifted across the break period — e.g., if right-wing parties post-2024 began moderating style while maintaining material impact, the correlation would decrease.
7. Gap Trajectory Interpretation
- Pre-2024 mean gap: 0.810
- Post-2024 mean gap: 0.643
- Gap change: -0.167
A widening gap (increasing material > stylistic) would indicate that right-wing motions became less stylistically extreme but maintained or increased their material impact — consistent with the 'strategic moderation of rhetoric' hypothesis.
A narrowing gap would suggest that stylistic and material dimensions are converging, meaning the distinctions between the two become less meaningful over time.
A stable gap suggests the two dimensions move in parallel, and the flat single-dimension trend is an accurate summary (no masked divergence).
8. Domain Stratification
| Domain | Pre Mean Stijl | Pre Mean Mat | Post Mean Stijl | Post Mean Mat | Pre Gap | Post Gap | Pre r | Post r |
|---|---|---|---|---|---|---|---|---|
| Migration | 2.757 | 3.293 | 2.607 | 3.126 | 0.535 | 0.519 | 0.553 | 0.417 |
| Non-migration | 1.651 | 2.486 | 1.616 | 2.281 | 0.835 | 0.665 | 0.421 | 0.277 |
9. Gravity-Weighted Trends (Right-Wing)
Yearly means for right-wing motions filtered by material impact thresholds. M≥3 = motions with substantive material impact (score ≥ 3). M≥4 = motions with fundamental material impact (score ≥ 4).
| Year | N (all RW) | M≥3 N | M≥4 N | Stijl (all) | Stijl M≥3 | Stijl M≥4 | Mat (all) | Mat M≥3 | Mat M≥4 |
|---|---|---|---|---|---|---|---|---|---|
| 2016 | 6 | 2 | 1 | 1.667 | 3.000 | 3.000 | 2.333 | 3.500 | 4.000 |
| 2017 | 0 | 0 | 0 | N/A | N/A | N/A | N/A | N/A | N/A |
| 2018 | 5 | 0 | 0 | 1.000 | N/A | N/A | 1.400 | N/A | N/A |
| 2019 | 195 | 125 | 49 | 2.046 | 2.344 | 2.755 | 2.913 | 3.480 | 4.224 |
| 2020 | 469 | 307 | 109 | 2.228 | 2.603 | 3.119 | 2.906 | 3.450 | 4.266 |
| 2021 | 425 | 270 | 143 | 1.755 | 1.978 | 2.364 | 2.976 | 3.670 | 4.266 |
| 2022 | 446 | 216 | 60 | 1.800 | 2.065 | 2.467 | 2.525 | 3.324 | 4.167 |
| 2023 | 365 | 188 | 96 | 1.575 | 1.787 | 2.052 | 2.690 | 3.601 | 4.177 |
| 2024 | 469 | 259 | 75 | 1.680 | 1.965 | 2.067 | 2.582 | 3.320 | 4.107 |
| 2025 | 455 | 157 | 45 | 1.695 | 2.287 | 2.911 | 2.332 | 3.369 | 4.289 |
| 2026 | 195 | 76 | 15 | 2.015 | 2.263 | 3.000 | 2.405 | 3.211 | 4.067 |
| Bucket | Pre-2024 Mean Stijl | Pre-2024 Mean Mat | Post-2024 Mean Stijl | Post-2024 Mean Mat |
|---|---|---|---|---|
| All RW | 1.725 | 2.535 | 1.797 | 2.440 |
| M≥3 | 2.296 | 3.504 | 2.172 | 3.300 |
| M≥4 | 2.626 | 4.183 | 2.659 | 4.154 |
10. Figure
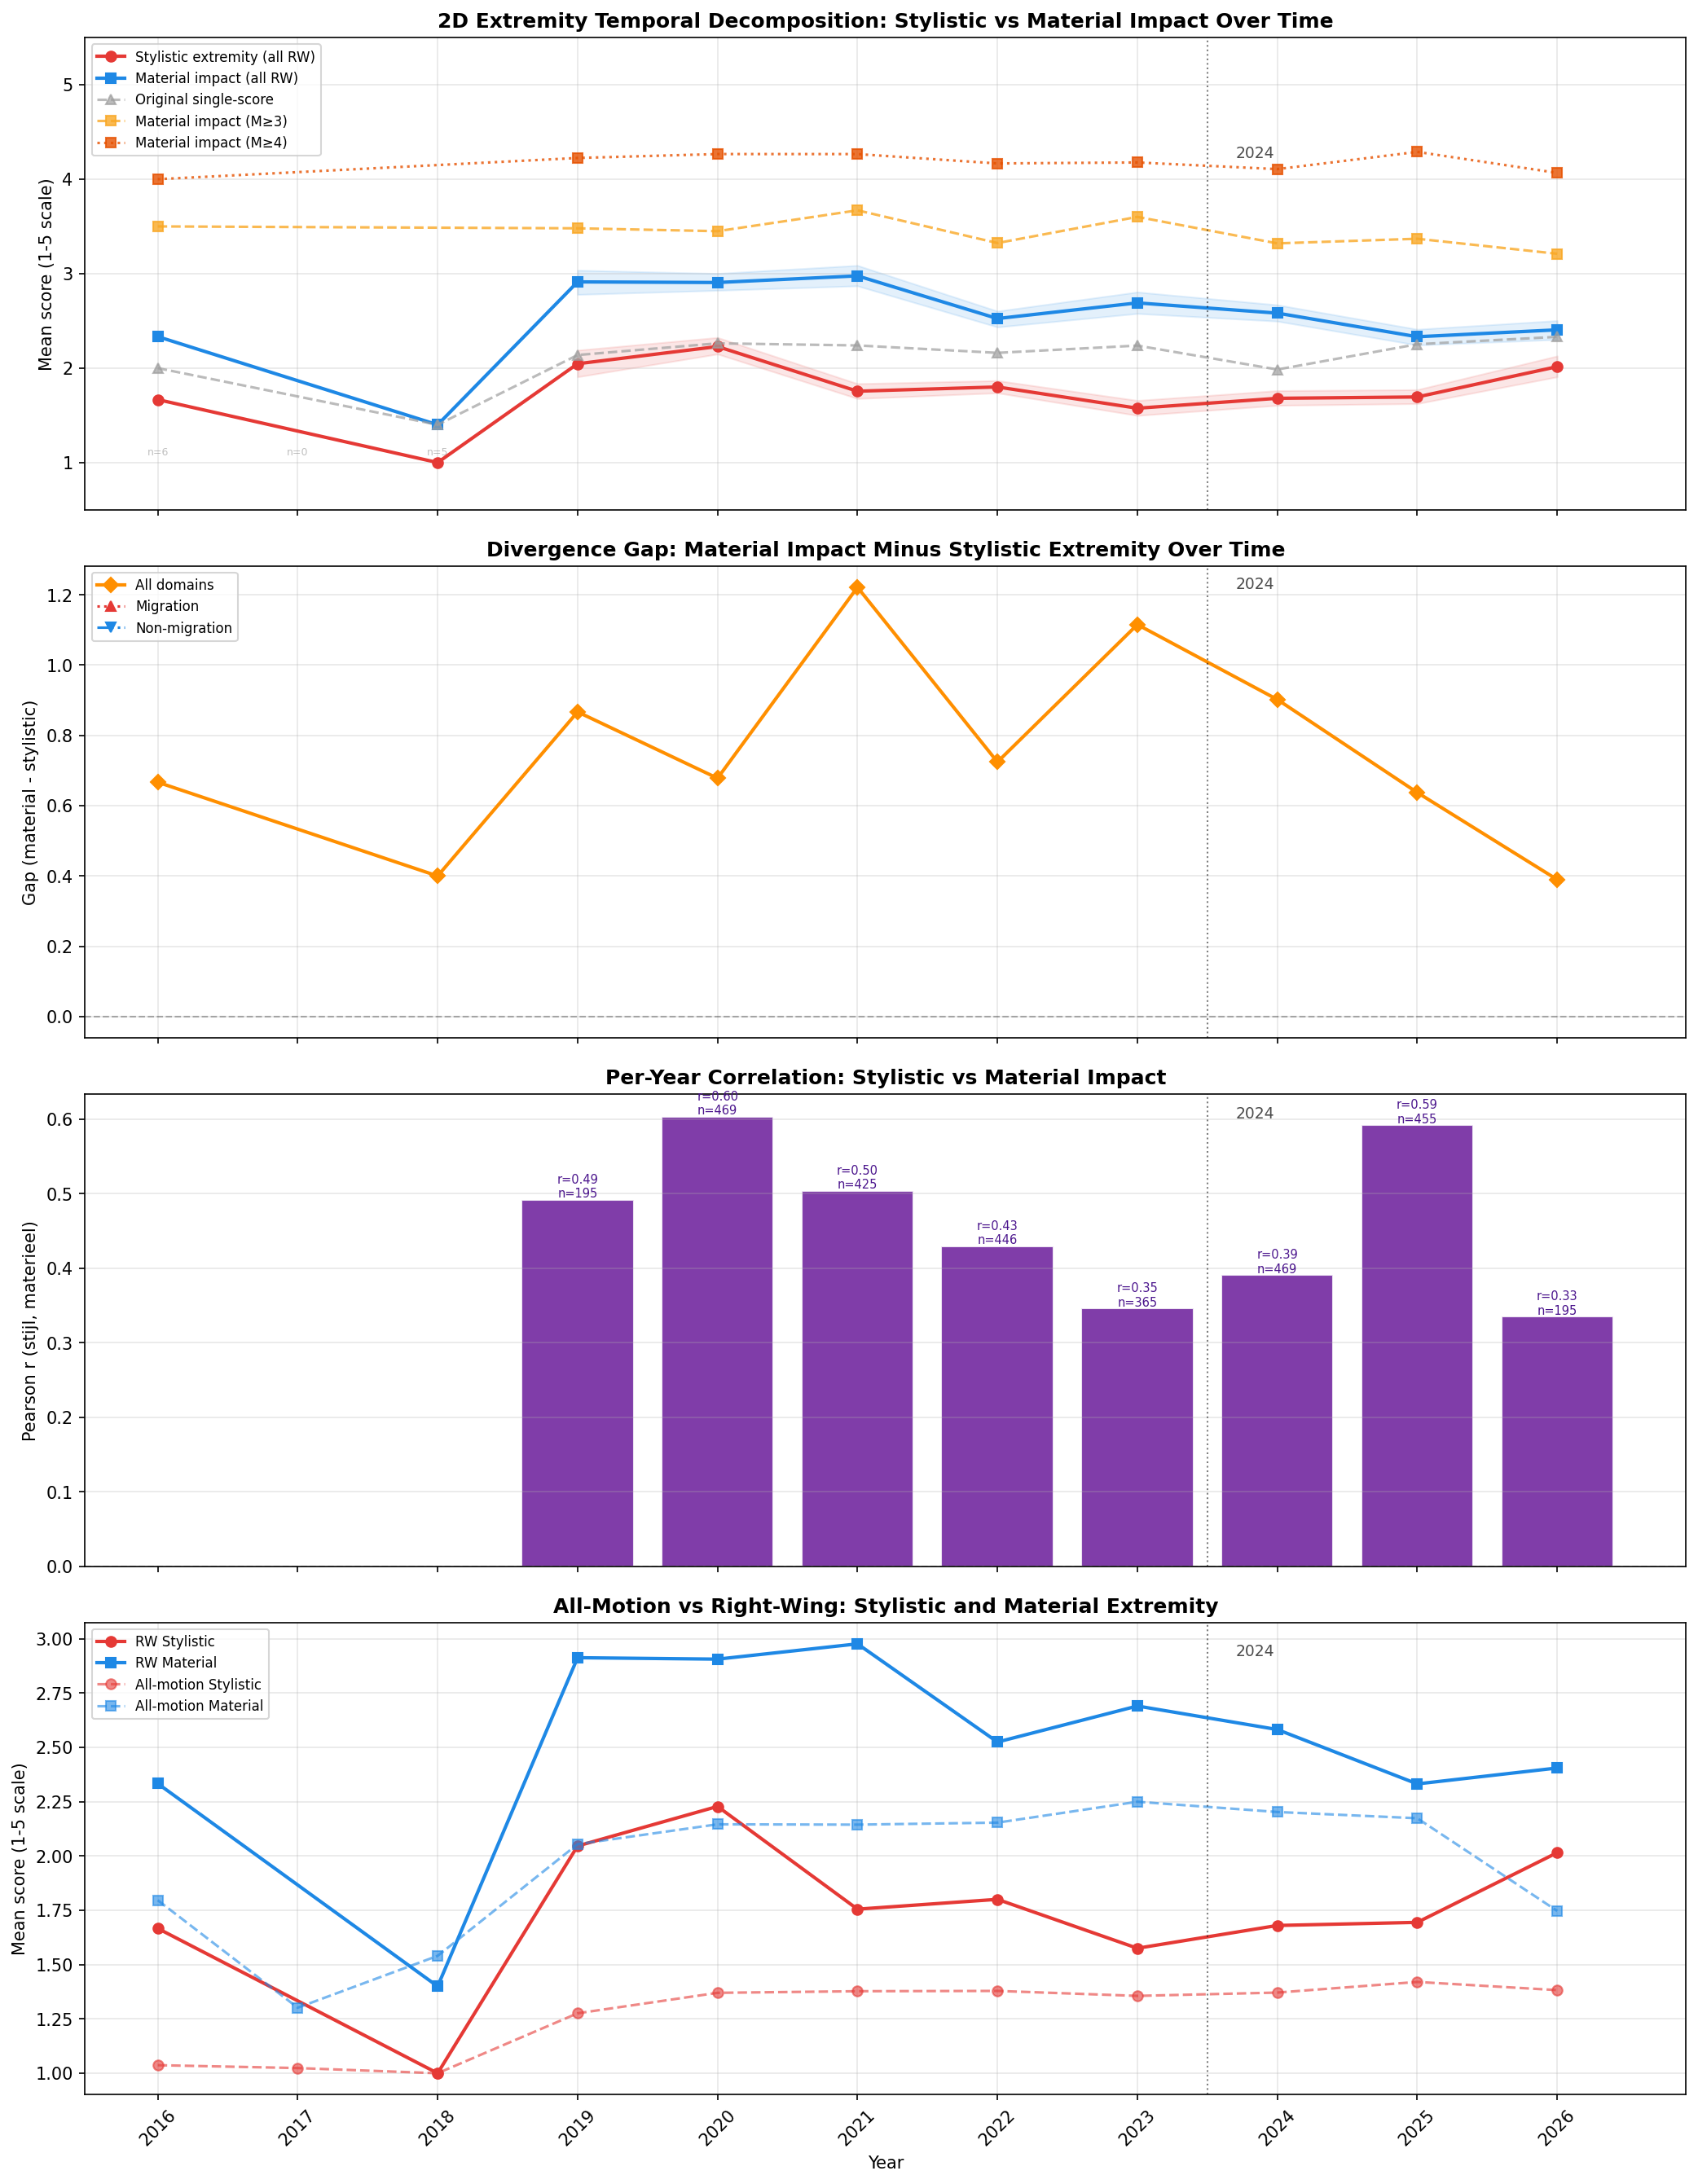
Figure panels:
- Top panel: Yearly mean stylistic (red) and material (blue) extremity scores with
95% bootstrap confidence intervals. Grey dashed line = original single-dimension
text_scorefor comparison. Gold/orange lines show material impact for M≥3 and M≥4 subsets. - Second panel: Gap trajectory (material minus stylistic) for all domains, migration, and non-migration. Positive gap = material impact exceeds stylistic extremity. A widening gap indicates increasing divergence between dimensions.
- Third panel: Per-year Pearson correlation between stylistic and material scores. Declining correlation over time suggests the two dimensions are decoupling.
- Fourth panel: All-motion (dashed) vs right-wing (solid) comparison for both stylistic and material dimensions. Shows how right-wing trends compare to the full motion landscape.
11. Limitations
- Yearly resolution: Year-level aggregation necessarily smooths within-year trends. The quarterly framework from U1 provides finer resolution for other metrics.
- Low-N years: Some years (especially 2016-2018 and 2026) have fewer than 50 scored motions, reducing confidence in those yearly means.
- 2D scores are LLM-generated: The
stijl_extremiteitandmateriele_impactscores come from LLM-based assessment and may contain systematic biases. - Correlation vs causation: Per-year correlations describe association, not causation. A declining correlation could reflect scoring drift rather than genuine decoupling.
- Domain imbalance: Migration-domain motions are a minority of all right-wing motions, so domain-stratified analyses have lower statistical power.
12. All-Motion Comparison
Yearly means for ALL motions (from extremity_scores_all) compared to right-wing-only means.
This provides context for whether right-wing trends reflect party-specific dynamics or broader
parliamentary trends.
| Year | N (all) | All Stijl | All Mat | N (RW) | RW Stijl | RW Mat | Diff Stijl | Diff Mat |
|---|---|---|---|---|---|---|---|---|
| 2016 | 162 | 1.037 | 1.796 | 6 | 1.667 | 2.333 | 0.630 | 0.537 |
| 2017 | 126 | 1.024 | 1.302 | 0 | N/A | N/A | N/A | N/A |
| 2018 | 124 | 1.000 | 1.540 | 5 | 1.000 | 1.400 | 0.000 | -0.140 |
| 2019 | 3374 | 1.276 | 2.055 | 195 | 2.046 | 2.913 | 0.770 | 0.858 |
| 2020 | 4223 | 1.370 | 2.146 | 469 | 2.228 | 2.906 | 0.858 | 0.760 |
| 2021 | 4283 | 1.378 | 2.144 | 425 | 1.755 | 2.976 | 0.378 | 0.832 |
| 2022 | 4115 | 1.379 | 2.154 | 446 | 1.800 | 2.525 | 0.422 | 0.371 |
| 2023 | 3272 | 1.356 | 2.250 | 365 | 1.575 | 2.690 | 0.219 | 0.441 |
| 2024 | 3965 | 1.371 | 2.203 | 469 | 1.680 | 2.582 | 0.309 | 0.380 |
| 2025 | 3712 | 1.420 | 2.174 | 455 | 1.695 | 2.332 | 0.274 | 0.158 |
| 2026 | 2214 | 1.383 | 1.747 | 195 | 2.015 | 2.405 | 0.633 | 0.658 |
| Period | All Stijl | All Mat | RW Stijl | RW Mat | Stijl Δ | Mat Δ |
|---|---|---|---|---|---|---|
| Pre-2024 | 1.227 | 1.923 | 1.725 | 2.535 | 0.497 | 0.612 |
| Post-2024 | 1.391 | 2.041 | 1.797 | 2.440 | 0.405 | 0.399 |
13. Conclusion
The overall stijl-materieel correlation is r=0.472 (p=0.000000), consistent with the aggregate finding of r≈0.47.
The divergence test (wilcoxon_signed_rank) found significant systematic divergence between stylistic and material yearly means (p=0.002).
The pre/post correlation change analysis no significant change in stijl-material correlation (u=10.0, p=0.5714).
The gap (material minus stylistic) narrowed from 0.810 pre-2024 to 0.643 post-2024.