What if you could take every motion voted on in the Dutch Parliament over the past decade and automatically plot parties and MPs on a political map — with zero manual labeling?
That's exactly what this project does. Here's how I built it, what I had to solve along the way, and what it revealed about Dutch political dynamics.
The Dutch Parliament publishes every vote — every motie, every amendement, every besluit — in an open OData API. We're talking over 28,000 distinct motions spanning 2016 to 2026, each with a record of how every individual MP voted: voor (for), tegen (against), onthouden (abstained), or afwezig (absent). That's over 500,000 individual vote records.
This is an extraordinary dataset. But in raw form it's just a table of votes. The interesting question is: can we extract structure — left vs. right, progressive vs. conservative, governing vs. opposition — purely from the pattern of who votes with whom?
The answer is yes, and the method is surprisingly elegant.
Each motion is a snapshot of political alignment. For each motion, we know which MPs voted together and which voted apart. If every PvdA and GroenLinks MP votes the same way almost every time, that tells us something. If PVV and CDA MPs diverge consistently, that tells us something too.
I represent this with Singular Value Decomposition (SVD) on the MP × motion matrix:
SVD finds the dominant axes of variation — the directions along which the chamber disagrees most. The first component almost always corresponds to a left-right axis. The second typically captures something like progressive-traditionalist or libertarian-authoritarian. The key point: the axes emerge from the math, not from any labeling on my part.
Running SVD independently per time window creates a subtle problem: SVD axes are arbitrarily oriented. The "left-right" axis from 2020-Q3 and the "left-right" axis from 2021-Q1 might point in completely different directions — even if the underlying politics barely changed. You can't just stack the coordinates and call it a trajectory.
The fix is Procrustes alignment: given two sets of party/MP positions across consecutive windows, find the rotation matrix R that best maps one onto the other (minimizing the Frobenius norm of the difference), using MPs who appear in both windows as anchors:
R = argmin_R ||A − B @ R||_F, subject to R'R = IThis is solved cleanly via SVD of the cross-covariance matrix (a nice piece of mathematical symmetry — SVD to build the space, SVD to align it). The result: a continuous track for every party from 2019 to 2026, where position changes reflect genuine political movement rather than axis flips.
Once we have SVD vectors for every motion in a window, we can find the most politically similar motions. Two motions are close if they produce a similar split in the chamber — same parties voting the same way.
The similarity computation is pure NumPy: load all SVD vectors for a window, L2-normalize, compute cosine similarity via a single matrix multiply, then extract top-k neighbors. For a 4,000-motion quarter, that's a 4000×4000 matrix — fast enough without batching.
| Year | Motions | Breakdown |
|---|---|---|
| 2016 | 162 | Mostly legislative proposals (data incomplete) |
| 2017 | 126 | Mostly legislative proposals (data incomplete) |
| 2018 | 124 | Mostly legislative proposals (data incomplete) |
| 2019 | 3,374 | 2,058 moties + 350 amendementen |
| 2020 | 4,223 | 3,141 moties + 354 amendementen |
| 2021 | 4,283 | 3,395 moties + 236 amendementen |
| 2022 | 4,115 | 3,255 moties + 290 amendementen |
| 2023 | 3,272 | 2,557 moties + 217 amendementen |
| 2024 | 3,965 | 3,007 moties + 359 amendementen |
| 2025 | 3,712 | 2,900 moties + 251 amendementen |
| 2026 | 948 | 849 moties + 21 amendementen (partial year) |
Early years (2016–2018) are incomplete — the API data for this period is sparse and mostly contains legislative proposals rather than parliamentary motions. From 2019 onwards, the data is comprehensive, running quarterly for 41 time windows in total.
The raw data preserves the distinction carefully. From 2019 through mid-2023, the svd_vectors table lists GroenLinks and PvdA as separate entries per window. From late 2023 onwards — when the merger formally took effect in parliament — a single GroenLinks-PvdA entity appears. The pipeline tracks this faithfully: you can literally watch two separate points on the political compass drift together and then merge into one.
What's striking is how early the convergence is visible. By 2021 — two full years before the merger announcement — GroenLinks and PvdA coordinates in the SVD space are nearly overlapping. At the individual MP level, there was occasional divergence on defense and security votes (GroenLinks MPs pulling slightly away from the PvdA centroid), but at the party level they were practically indistinguishable.
This created an interesting pipeline challenge: the party normalization step has a mapping that folds both names into GroenLinks-PvdA across the entire dataset. For the post-merger period that's correct; for the pre-merger period it's a simplification that hides the convergence story. The raw vectors still capture it — you just have to know to look.
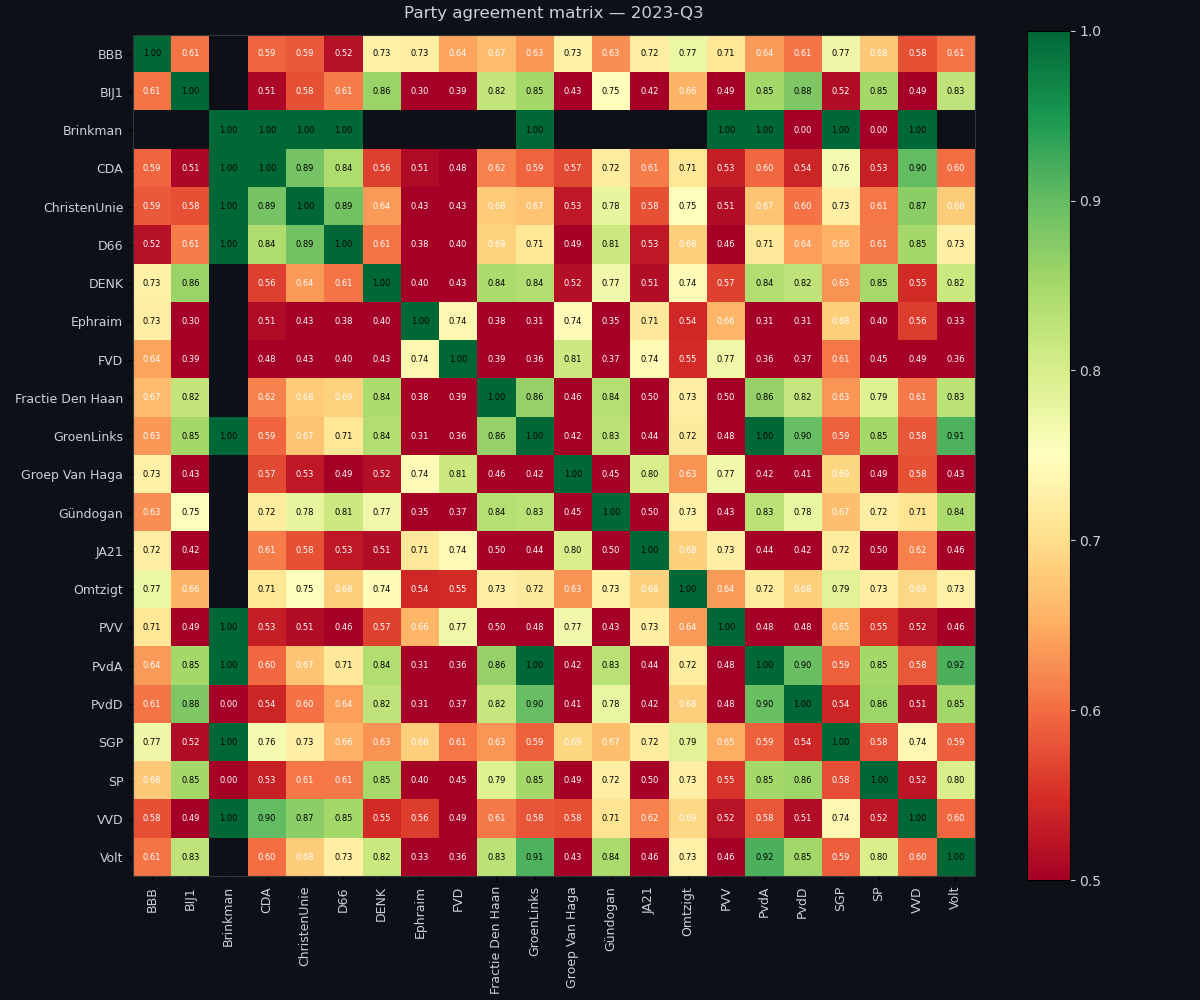
After the formal merger, GroenLinks-PvdA became one of the most cohesive parties in parliament. Their internal voting discipline rivals SGP and ChristenUnie — near-perfect blocs. VVD, by contrast, shows the most internal variation, which tracks with what you'd expect from a large centrist party managing conflicting wings.
During the Rutte IV cabinet (2022–2023), a recurring pattern emerged: PVV, FvD, and JA21 (right-wing) would vote with SP, GroenLinks-PvdA, PvdD, DENK, and Volt (left-wing) against the governing parties VVD, D66, CDA, and ChristenUnie. This isn't a one-off — it happened on dozens of motions.
The topics tell the story:
This is the classic "horseshoe" pattern in political science — the extremes converging against the center — but it's remarkable to see it so clearly in the voting geometry. It's not ideological agreement between left and right; it's a shared opposition to the governing consensus.
When BBB (BoerBurgerBeweging) entered parliament after the 2023 provincial elections, their SVD position placed them between PVV and CDA — consistent with their policy profile: agrarian-nationalist populism with Catholic-provincial roots. New parties don't get to pick their geometric location; the voting record places them. That BBB landed exactly where you'd expect is a good validity check.
What the geometry also shows: BBB started close to PVV on the nationalist axis, but drifted toward the CDA cluster over their first year in parliament — visible as a curved trajectory rather than a fixed point.
The controversy score (1 − winning_margin) reveals the knife-edge votes. In the current fragmented parliament, the tightest split is a perfect 8–8 party-line tie — decided by the chamber chair's casting vote. These happened on:
The narrowest non-tie votes are razor-thin too: Wilders' asylum emergency stop motion lost by the slimmest margin (5 parties for, 16 tied — effectively blocked), while Marijnissen's motion against private equity in GP practices nearly flipped the other way (16 for, 5 tied). On a different day, a different MP showing up, Dutch immigration and healthcare policy could have shifted.
More broadly, over 15,000 motions had winning margins below 55% — these are the genuinely contested decisions, not the rubber stamps. At the other extreme, about 3,700 motions passed with 95%+ support: the uncontroversial consensus items that rarely make headlines.
Single DuckDB database, modular Python pipeline, no cloud infrastructure:
API (Tweede Kamer OData)
  → download_past_year.py        → motions table (28,304 rows)

motions
  → extract_mp_votes.py          → mp_votes table (508,765 rows)
  → sync_motion_content.py       → body_text enrichment (~94% coverage)
  → svd_pipeline.py              → svd_vectors table (73,165 rows, 41 windows)

svd_vectors
  → similarity/compute.py        → similarity_cache (top-10 per window)
The similarity computation is pure NumPy: load all SVD vectors for a window, pad to uniform length, L2-normalize, compute the full cosine similarity matrix via a single matrix multiply, then extract top-k neighbors. For a 4,000-motion quarter, that's a 4000×4000 matrix operation — fast enough that batching isn't needed.
The database sits at ~18 GB on disk — the full parliamentary text for 26,000+ motions accounts for most of that.
One of the trickiest problems was labeling the SVD axes. The first component reliably captures left-right economics. But components 3 through 10? The mathematical procedure is sound — SVD finds the directions of maximum variance — but the meaning of each axis has to be derived from the actual motions that load heavily on it.
I solved this by extracting the top 50 motions per component (by absolute loading score), then analyzing their content. Some clear patterns emerged:
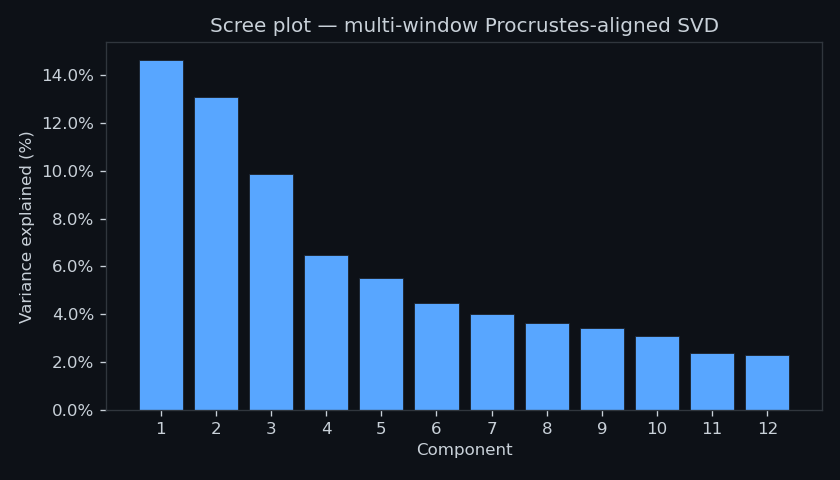 Scree plot across 41 aligned quarterly windows. PC1 = 14.6%, PC2 = 13.1%.
Motion explorer: Given a motion, retrieve the 10 most politically similar ones from across the decade. Trace how a policy debate evolved — who championed it, how the coalitions shifted.
Party trajectory animation: Procrustes-aligned positions, animated year by year. Watch GroenLinks-PvdA's pre-merger convergence, watch PVV consolidate its flank, watch new parties arrive and find their geometric home.
Cross-party coalition patterns: Which topics produce unusual coalition configurations — motions where the normal left-right split breaks down and unexpected alliances form.
Cabinet crisis detection: Track coalition cohesion over time. When do coalition parties start voting against each other? The Procrustes disparity between consecutive windows is itself a signal of structural political shifts.
# Download historical data
python scripts/download_past_year.py --start-date 2016-01-01 --end-date 2026-01-01

# Run full pipeline (SVD, similarity cache)
python -m pipeline.run_pipeline --db-path data/motions.db \
    --start-date 2016-01-01 --end-date 2026-01-01 \
    --window-size quarterly --text-batch-size 200

# Enrich with full motion body text
python scripts/sync_motion_content.py --db-path data/motions.db
All computation — SVD, similarity — runs locally on a single machine. No cloud services, no GPU required.
Democracy is more legible than it looks.